Figure 4
Imaging modalities delivery of RNAi therapeutics in cancer therapy and clinical applications
Loutfy H Madkour*
Published: 04 March, 2021 | Volume 5 - Issue 1 | Pages: 005-034
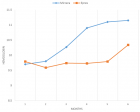
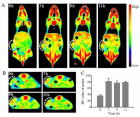
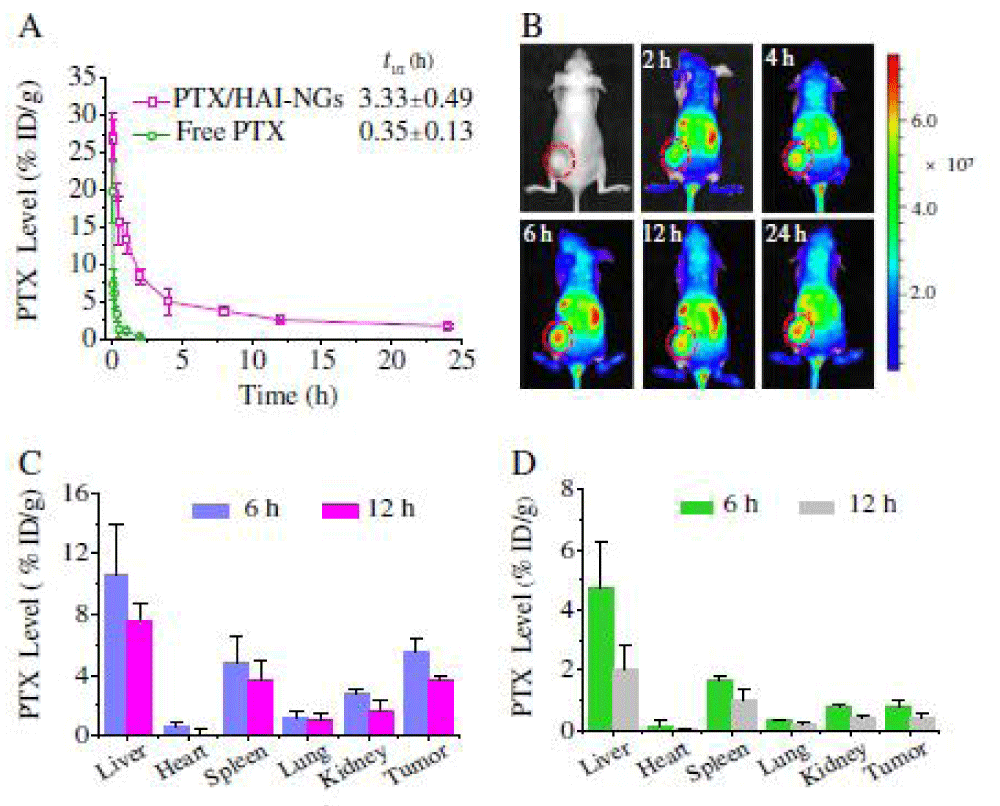 in vivo pharmacokinetics, NIR imaging and bio distribution studies. (A) in vivo pharmacokinetics of PTX/HAI-NGs and free PTX in mice. PTX level is expressed as % injected dose per gram of tissue (%ID/g). Data are presented as mean ± SD (n = 3); (B) in vivo fluorescence images of MCF-7 human breast tumor bearing nude mice at different time points following tail vein injection of Cy5-loaded nanogels. Circled areas indicate the locations of the tumor. PTX level, expressed as % injected dose per gram of tissue (% ID/g), in the tumor and different organs after 6 or 12 h post injection of PTX/HAI-NGs (C) or free PTX (D). Data are presented as mean ± SD (n = 3)." alt="jro-aid1035-g014"class="img-responsive img-rounded " style="cursor:pointer">
Figure 4:
in vivo pharmacokinetics, NIR imaging and bio distribution studies. (A) in vivo pharmacokinetics of PTX/HAI-NGs and free PTX in mice. PTX level is expressed as % injected dose per gram of tissue (%ID/g). Data are presented as mean ± SD (n = 3); (B) in vivo fluorescence images of MCF-7 human breast tumor bearing nude mice at different time points following tail vein injection of Cy5-loaded nanogels. Circled areas indicate the locations of the tumor. PTX level, expressed as % injected dose per gram of tissue (% ID/g), in the tumor and different organs after 6 or 12 h post injection of PTX/HAI-NGs (C) or free PTX (D). Data are presented as mean ± SD (n = 3).
Read Full Article HTML DOI: 10.29328/journal.jro.1001035 Cite this Article Read Full Article PDF
More Images
Similar Articles
-
Photon Absorption characteristics of some selected Enzyme Inhibitors used in Cancer Research in the Energy range 1 keV-100 GeVMustafa Recep Kaçal,Hüseyin Ali Karataş,Ferdi Akman*. Photon Absorption characteristics of some selected Enzyme Inhibitors used in Cancer Research in the Energy range 1 keV-100 GeV. . 2017 doi: 10.29328/journal.jro.1001009; 1: 060-068
-
Near Complete Response to 177Lu-PSMA-DKFZ-617 Therapy in a Patient with Metastatic Castration Resistant Prostate CancerMadhav Prasad Yadav,Sanjana Ballal a,Chandrasekhar Bal*. Near Complete Response to 177Lu-PSMA-DKFZ-617 Therapy in a Patient with Metastatic Castration Resistant Prostate Cancer. . 2017 doi: 10.29328/journal.jro.1001012; 1: 083-086
-
Hyperthermia and Breast cancer: A short reviewBora Uysal*. Hyperthermia and Breast cancer: A short review. . 2017 doi: 10.29328/journal.jro.1001011; 1: 079-082
-
Imaging modalities delivery of RNAi therapeutics in cancer therapy and clinical applicationsLoutfy H Madkour*. Imaging modalities delivery of RNAi therapeutics in cancer therapy and clinical applications. . 2021 doi: 10.29328/journal.jro.1001035; 5: 005-034
-
Anal cancer - impact of interstitial brachytherapyRegináčová K*,Kubecová M,Vránová J,Šejdová M. Anal cancer - impact of interstitial brachytherapy. . 2021 doi: 10.29328/journal.jro.1001034; 5: 001-004
-
Role of HRCT Thorax in preoperative assessment of RT-PCR COVID-19 negative oral cancer patientsRajesh A Kantharia*,Roopa Ganta,Shehnaz R Kantharia,Bhavin Bhupendra Shah,Rajinikant Mohan Vasava,Tushar Vishnuprasad Vaishnav. Role of HRCT Thorax in preoperative assessment of RT-PCR COVID-19 negative oral cancer patients. . 2020 doi: 10.29328/journal.jro.1001033; 4: 008-011.
-
8 Gy single dose radiotherapy for bone metastasis in COVID-19 pandemia period: ReviewBora Uysal*,Hakan Gamsız,Ferrat Dincoglan,Omer Sager,Selcuk Demiral ,Murat Beyzadeoglu. 8 Gy single dose radiotherapy for bone metastasis in COVID-19 pandemia period: Review. . 2020 doi: 10.29328/journal.jro.1001032; 4: 005-007.
-
Percentage of Positive Biopsy Cores Predicts Presence of a Dominant Lesion on MRI in Patients with Intermediate Risk Prostate CancerJason M Slater,William W Millard,Samuel M Randolph,Thomas J Kelly,David A Bush*. Percentage of Positive Biopsy Cores Predicts Presence of a Dominant Lesion on MRI in Patients with Intermediate Risk Prostate Cancer. . 2018 doi: 10.29328/journal.jro.1001025; 2: 073-079
-
Adaptive planning and toxicities of uniform scanning proton therapy for lung cancer patientsYuanshui Zheng*,Hardev Singh,Suresh Rana,Gary Larson,Prabhu Kiran,Lucius Doh,James Wong. Adaptive planning and toxicities of uniform scanning proton therapy for lung cancer patients. . 2018 doi: 10.29328/journal.jro.1001023; 2: 055-061
-
Incidental findings in traditional nuclear medicine practiceGiuseppe De Vincentis,Mariano Pontico,Maria Ricci,Viviana Frantellizzi*,Mauro Liberatore. Incidental findings in traditional nuclear medicine practice. . 2018 doi: 10.29328/journal.jro.1001019; 2: 036-040
Recently Viewed
-
Minimising Carbon Footprint in Anaesthesia PracticeNisha Gandhi and Abinav Sarvesh SPS*. Minimising Carbon Footprint in Anaesthesia Practice. Int J Clin Anesth Res. 2024: doi: 10.29328/journal.ijcar.1001025; 8: 005-007
-
On Friedman equation, quadratic laws and the geometry of our universeS Kalimuthu*. On Friedman equation, quadratic laws and the geometry of our universe. Int J Phys Res Appl. 2021: doi: 10.29328/journal.ijpra.1001041; 4: 048-050
-
Texture of Thin Films of Aluminum Nitride Produced by Magnetron SputteringStrunin Vladimir Ivanovich,Baranova Larisa Vasilievna*,Baisova Bibigul Tulegenovna. Texture of Thin Films of Aluminum Nitride Produced by Magnetron Sputtering. Int J Phys Res Appl. 2025: doi: 10.29328/journal.ijpra.1001106; 8: 013-016
-
KYAMOS Software - Mini Review on the Computer-Aided Engineering IndustryAntonis Papadakis*,Sofia Nikolaidou. KYAMOS Software - Mini Review on the Computer-Aided Engineering Industry. Int J Phys Res Appl. 2025: doi: 10.29328/journal.ijpra.1001105; 8: 010-012
-
The Theory of ElementsAbdellah El-Mourabet*. The Theory of Elements. Int J Phys Res Appl. 2025: doi: 10.29328/journal.ijpra.1001104; 8: 001-009
Most Viewed
-
Evaluation of Biostimulants Based on Recovered Protein Hydrolysates from Animal By-products as Plant Growth EnhancersH Pérez-Aguilar*, M Lacruz-Asaro, F Arán-Ais. Evaluation of Biostimulants Based on Recovered Protein Hydrolysates from Animal By-products as Plant Growth Enhancers. J Plant Sci Phytopathol. 2023 doi: 10.29328/journal.jpsp.1001104; 7: 042-047
-
Sinonasal Myxoma Extending into the Orbit in a 4-Year Old: A Case PresentationJulian A Purrinos*, Ramzi Younis. Sinonasal Myxoma Extending into the Orbit in a 4-Year Old: A Case Presentation. Arch Case Rep. 2024 doi: 10.29328/journal.acr.1001099; 8: 075-077
-
Feasibility study of magnetic sensing for detecting single-neuron action potentialsDenis Tonini,Kai Wu,Renata Saha,Jian-Ping Wang*. Feasibility study of magnetic sensing for detecting single-neuron action potentials. Ann Biomed Sci Eng. 2022 doi: 10.29328/journal.abse.1001018; 6: 019-029
-
Pediatric Dysgerminoma: Unveiling a Rare Ovarian TumorFaten Limaiem*, Khalil Saffar, Ahmed Halouani. Pediatric Dysgerminoma: Unveiling a Rare Ovarian Tumor. Arch Case Rep. 2024 doi: 10.29328/journal.acr.1001087; 8: 010-013
-
Physical activity can change the physiological and psychological circumstances during COVID-19 pandemic: A narrative reviewKhashayar Maroufi*. Physical activity can change the physiological and psychological circumstances during COVID-19 pandemic: A narrative review. J Sports Med Ther. 2021 doi: 10.29328/journal.jsmt.1001051; 6: 001-007

HSPI: We're glad you're here. Please click "create a new Query" if you are a new visitor to our website and need further information from us.
If you are already a member of our network and need to keep track of any developments regarding a question you have already submitted, click "take me to my Query."


