Figure 3
New Approach for Analysing the Discrepancy of Pretherapeutic Tc-99m and Intra-therapeutic I-131 uptake in Scintigraphies of Thyroid Autonomies using a Parametric 3D Analysis Program
Maaz Zuhayra, Marlies Marx, Ulrich Karwacik, Yi Zhao and Ulf Lützen*
Published: 02 January, 2017 | Volume 1 - Issue 1 | Pages: 001-011
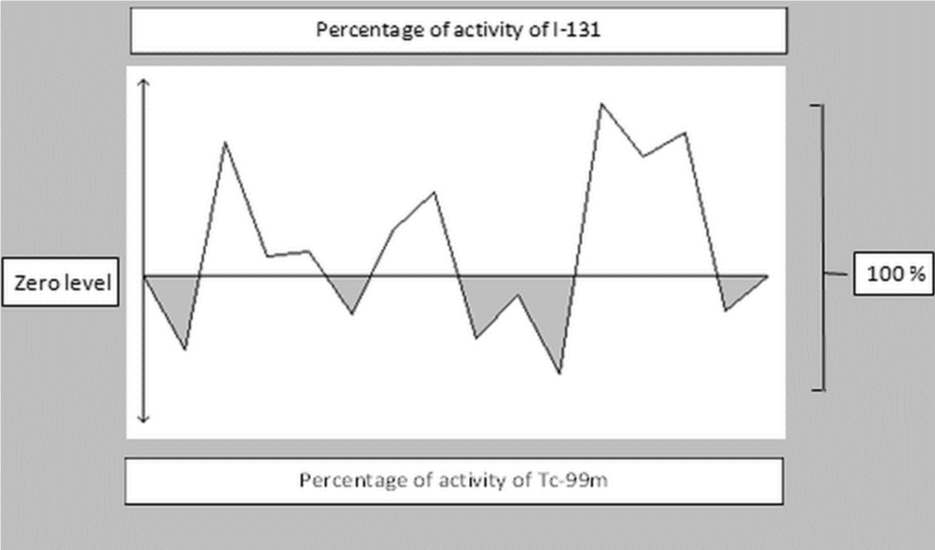
Figure 3:
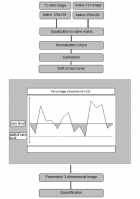
Diagram representing the calculation of absolute numerical values from Table 1 in percent [%]. The grey-shaded areas (here approximately 40%) represent the integral of the curves below zero level for Tc-99m-O4-; the white-shaded areas (here approximately 60 %) represent the integral of the curves above zero level for I-131.
Read Full Article HTML DOI: 10.29328/journal.jro.1001001 Cite this Article Read Full Article PDF
More Images
Similar Articles
-
New Approach for Analysing the Discrepancy of Pretherapeutic Tc-99m and Intra-therapeutic I-131 uptake in Scintigraphies of Thyroid Autonomies using a Parametric 3D Analysis ProgramMaaz Zuhayra,Marlies Marx,Ulrich Karwacik,Yi Zhao,Ulf Lützen*. New Approach for Analysing the Discrepancy of Pretherapeutic Tc-99m and Intra-therapeutic I-131 uptake in Scintigraphies of Thyroid Autonomies using a Parametric 3D Analysis Program. . 2017 doi: 10.29328/journal.jro.1001001; 1: 001-011
-
Dr. Saul Hertz Discovers the Medical Uses of Radioiodine (RAI)Barbara Hertz*. Dr. Saul Hertz Discovers the Medical Uses of Radioiodine (RAI). . 2018 doi: 10.29328/journal.jro.1001022; 2: 053-054
-
“Thyroid”: Letter to the Editor, Radioactive Iodine: A Living HistoryBarbara Hertz*. “Thyroid”: Letter to the Editor, Radioactive Iodine: A Living History. . 2024 doi: 10.29328/journal.jro.1001058; 8: 001-002
Recently Viewed
-
Detecting Pneumothorax on Chest Radiograph Using Segmentation with Deep LearningJoshua Friedman, Peter Brotchie. Detecting Pneumothorax on Chest Radiograph Using Segmentation with Deep Learning. Ann Biomed Sci Eng. 2024: doi: 10.29328/journal.abse.1001031; 8: 032-038
-
Intelligent Design of Ecological Furniture in Risk Areas based on Artificial SimulationTorres del Salto Rommy Adelfa*, Bryan Alfonso Colorado Pástor*. Intelligent Design of Ecological Furniture in Risk Areas based on Artificial Simulation. Arch Surg Clin Res. 2024: doi: 10.29328/journal.ascr.1001083; 8: 062-068
-
Precision Surgery: Three-dimensional Visualization Technology in the Diagnosis and Surgical Treatment of Abdominal CancerEmilio Vicente, Yolanda Quijano, Valentina Ferri, Riccardo Caruso. Precision Surgery: Three-dimensional Visualization Technology in the Diagnosis and Surgical Treatment of Abdominal Cancer. Arch Surg Clin Res. 2024: doi: 10.29328/journal.ascr.1001075; 8: 001-003
-
Association of Cytokine Gene Polymorphisms with Inflammatory Responses and Sepsis Outcomes in Surgical and Trauma PatientsAmália Cinthia Meneses do Rêgo, Irami Araújo-Filho. Association of Cytokine Gene Polymorphisms with Inflammatory Responses and Sepsis Outcomes in Surgical and Trauma Patients. Arch Surg Clin Res. 2024: doi: 10.29328/journal.ascr.1001076; 8: 004-008
-
Large Cystic Dilatation of the Common Bile DuctHouda Gazzah, Zied Hadrich, Yassine Tlili, Montacer Hafsi*, Mohamed Hajri, Sahir Omrani. Large Cystic Dilatation of the Common Bile Duct. Arch Surg Clin Res. 2024: doi: 10.29328/journal.ascr.1001077; 8: 009-010
Most Viewed
-
Evaluation of Biostimulants Based on Recovered Protein Hydrolysates from Animal By-products as Plant Growth EnhancersH Pérez-Aguilar*, M Lacruz-Asaro, F Arán-Ais. Evaluation of Biostimulants Based on Recovered Protein Hydrolysates from Animal By-products as Plant Growth Enhancers. J Plant Sci Phytopathol. 2023 doi: 10.29328/journal.jpsp.1001104; 7: 042-047
-
Sinonasal Myxoma Extending into the Orbit in a 4-Year Old: A Case PresentationJulian A Purrinos*, Ramzi Younis. Sinonasal Myxoma Extending into the Orbit in a 4-Year Old: A Case Presentation. Arch Case Rep. 2024 doi: 10.29328/journal.acr.1001099; 8: 075-077
-
Feasibility study of magnetic sensing for detecting single-neuron action potentialsDenis Tonini,Kai Wu,Renata Saha,Jian-Ping Wang*. Feasibility study of magnetic sensing for detecting single-neuron action potentials. Ann Biomed Sci Eng. 2022 doi: 10.29328/journal.abse.1001018; 6: 019-029
-
Pediatric Dysgerminoma: Unveiling a Rare Ovarian TumorFaten Limaiem*, Khalil Saffar, Ahmed Halouani. Pediatric Dysgerminoma: Unveiling a Rare Ovarian Tumor. Arch Case Rep. 2024 doi: 10.29328/journal.acr.1001087; 8: 010-013
-
Physical activity can change the physiological and psychological circumstances during COVID-19 pandemic: A narrative reviewKhashayar Maroufi*. Physical activity can change the physiological and psychological circumstances during COVID-19 pandemic: A narrative review. J Sports Med Ther. 2021 doi: 10.29328/journal.jsmt.1001051; 6: 001-007

HSPI: We're glad you're here. Please click "create a new Query" if you are a new visitor to our website and need further information from us.
If you are already a member of our network and need to keep track of any developments regarding a question you have already submitted, click "take me to my Query."


