More Information
Submitted: July 01, 2024 | Approved: July 08, 2024 | Published: July 09, 2024
How to cite this article: Valenzuela RF, Duran-Sierra E, Canjirathinkal M, Amini B, Torres KE, Benjamin RS, et al. Radiomics by Quantitative Diffusion-weighted MRI for Predicting Response in Patients with Extremity Soft-tissue Undifferentiated Pleomorphic Sarcoma. J Radiol Oncol. 2024; 8(2): 064-071. Available from: https://dx.doi.org/10.29328/journal.jro.1001066
DOI: 10.29328/journal.jro.1001066
Copyright License: © 2024 Valenzuela RF, et al. This is an open access article distributed under the Creative Commons Attribution License, which permits unrestricted use, distribution, and reproduction in any medium, provided the original work is properly cited.
Keywords: Apparent Diffusion Coefficient (ADC); Radiomics; Soft Tissue Sarcoma (STS); Undifferentiated Pleomorphic Sarcoma (UPS); Pathology-Assessed Treatment Effect (PATE)
Abbreviated title: ADC: Apparent Diffusion Coefficient; BL: Baseline; DBMS: Database Management System; DWI: Diffusion-Weighted Imaging; MRI: Magnetic Resonance Imaging; NR: Non-responders; PATE: Pathology-Assessed Treatment Effect; PC: Post-Chemotherapy; PD: Progressive Disease; PR: Partial Responders; PRT: Post-Radiation Therapy; R: Responders; STS: Soft Tissue Sarcoma; TIF: Treatment-Induced Fibrosis; TIH: Treatment-Induced Hemorrhage; TIN: Treatment-Induced Necrosis; UPS: Undifferentiated Pleomorphic Sarcoma; VOI: Volume of Interest; RECIST: Response Evaluation Criteria in Solid Tumors; WHO: World Health Organization
Radiomics by Quantitative Diffusion-weighted MRI for Predicting Response in Patients with Extremity Soft-tissue Undifferentiated Pleomorphic Sarcoma
RF Valenzuela1*, E Duran-Sierra1, M Canjirathinkal1, B Amini1, KE Torres2, RS Benjamin3, J Ma4, WL Wang5, KP Hwang5, RJ Stafford4, C Wu4, AM Zarzour3, AJ Bishop6, S Lo1, JE Madewell1, R Kumar1, WA Murphy Jr1 and CM Costelloe11*
1Department of Musculoskeletal Imaging, The University of Texas, MD Anderson Cancer Center, 1515 Holcombe Blvd., Unit 1475, Houston, TX 77030-4009, USA
2Department of Surgical Oncology, The University of Texas, MD Anderson Cancer Center, 1515 Holcombe Blvd., Unit 1475, Houston, TX 77030-4009, USA
3Department of Sarcoma Medical Oncology, The University of Texas, MD Anderson Cancer Center, 1515 Holcombe Blvd., Unit 1475, Houston, TX 77030-4009, USA
4Department of Imaging Physics, The University of Texas, MD Anderson Cancer Center, 1515 Holcombe Blvd., Unit 1475, Houston, TX 77030-4009, USA
5Department of Anatomical Pathology, The University of Texas, MD Anderson Cancer Center, 1515 Holcombe Blvd., Unit 1475, Houston, TX 77030-4009,USA
6Department of Radiation Oncology, The University of Texas, MD Anderson Cancer Center, 1515 Holcombe Blvd., Unit 1475, Houston, TX 77030-4009, USA
*Address for Correspondence: RF Valenzuela, Department of Musculoskeletal Imaging, The University of Texas, MD Anderson Cancer Center, 1515 Holcombe Blvd., Unit 1475, Houston, TX 77030-4009, USA, Email: rfvalenzuela@mdanderson.org
Purpose: This study aimed to determine the relevance of first- and high-order radiomic features derived from Diffusion-Weighted Imaging (DWI) and Apparent Diffusion Coefficient (ADC) maps for predicting treatment response in patients with Undifferentiated Pleomorphic Sarcoma (UPS).
Methods: This retrospective study included 33 extremity UPS patients with pre-surgical DWI/ADC and surgical resection. Manual volumetric tumor segmentation was performed on DWI/ADC maps acquired at Baseline (BL), Post-Chemotherapy (PC), and Post-Radiation Therapy (PRT). The percentage of pathology-assessed treatment effect (PATE) in surgical specimens categorized patients into responders (R; PATE ≥ 90%; 16 patients), partial-responders (PR; 89% - 31% PATE; 10 patients), and non-responders (NR; PATE ≤ 30%; 7 patients). 107 radiomic features were extracted from BL, PC, and PRT ADC maps. Statistical analyses compared R vs. PR/NR.
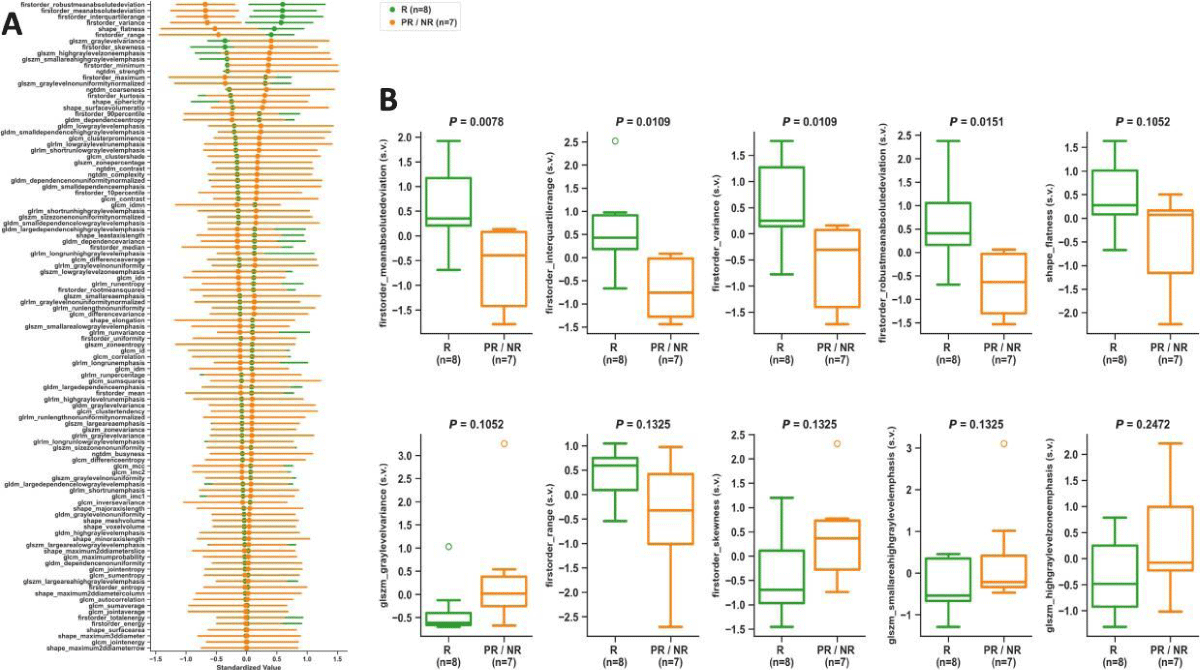
Results: Pseudo-progression at PC and universal stability at PRT were observed in R and PR/NR based on RECIST, WHO, and volumetric assessments. At PRT, responders displayed a 35% increase in ADC mean (p = 0.0034), a 136% decrease in skewness (p = 0.0001), and a 363% increase in the 90th percentile proportion (p = 0.0009). Comparing R vs. PR/NR at BL, statistically significant differences were observed in glrlm_highgraylevelrunemphasis (p = 0.0081), glrlm_shortrunhighgraylevelemphasis (p = 0.0138), gldm_highgraylevelemphasis (p = 0.0138), glcm_sumaverage (p = 0.0164), glcm_jointaverage (p = 0.0164), and glcm_autocorrelation (p = 0.0193). At PC, firstorder_meanabsolutedeviation (p = 0.0078), firstorder_interquartilerange (p = 0.0109), firstorder_variance (p = 0.0109), and firstorder_robustmeanabsolutedeviation (p = 0.0151) provided statistically significant differences.
Conclusion: Observing a high post-therapeutic ADC mean, low skewness, and high 90th percentile proportion with respect to baseline is predictive of successfully treated UPS patients presenting > 90% PATE. Highly significant higher-order radiomic results include glrlm-highgraylevelrunemphasis (BL) and first-order-mean absolute deviation (PC).
Soft Tissue Sarcomas (STS) are an uncommon and diverse subgroup of malignant tumors [1,2]. The largest subgroup is Undifferentiated Pleomorphic Sarcoma (UPS), accounting for approximately 20% of all cases [3,4]. UPS tumors can occur in any part of the body at any age but are more common in older patients [5,6]. UPS represents an archetypical cellular STS imaging tumor model significantly different from primary myxoid, chondroid, lipomatous, or fibrous-rich STS [5,6].
Post-treatment characteristics of STS
After undergoing treatment, STS can exhibit decreased cell count with degenerative changes such as Treatment-Induced Necrosis (TIN), Treatment-Induced Fibrosis (TIF) or hyalinization, Treatment-Induced Hemorrhage (TIH) with the deposition of hemosiderin and intrusion of foamy macrophages [7]. Additionally, viable tumor cells in STS may be replaced with viable benign granulation tissue (TIF) instead of undergoing liquefaction or hemorrhagic necrosis. This makes determining the degree of treatment response difficult, as the tumor may have decreased, increased or retained the same size. Traditional response criteria, such as the Response Evaluation Criteria in Solid Tumors (RECIST) [8], World Health Organization (WHO) criteria [6], and volumetric measurements, require a significant reduction in tumor size to determine positive response and are generally unreliable for treatment response assessment for STS [5,9]. Pathology-assessed treatment effect (PATE) has demonstrated more robustness as a prognostic indicator in sarcomas [10,11]. Values ranging from 75% to 95% PATE have been reported to define responders. These studies have consistently shown high 5- and 10-year survival rates and low rates of tumor recurrences among responders with high PATE [10].
Functional MRI
Limitations of size-based response criteria (RECIST and WHO) and tumor volumetric measurements have prompted the exploration of new metrics capable of reliably assessing tumor response and providing early prognostic indicators. Functional MRI adds additional parameters [5,12] that allow the assessment of tumor biology, including cellularity and vascularity, utilizing sequences such as diffusion-weighted imaging (DWI) [13,14], contrast-enhanced susceptibility-weighted imaging (CE-SWI) [15,16], and perfusion-weighted imaging with dynamic contrast enhancement (PWI/DCE) [17,18].
Diffusion-Weighted Imaging (DWI) and Apparent Diffusion Coefficient (ADC)
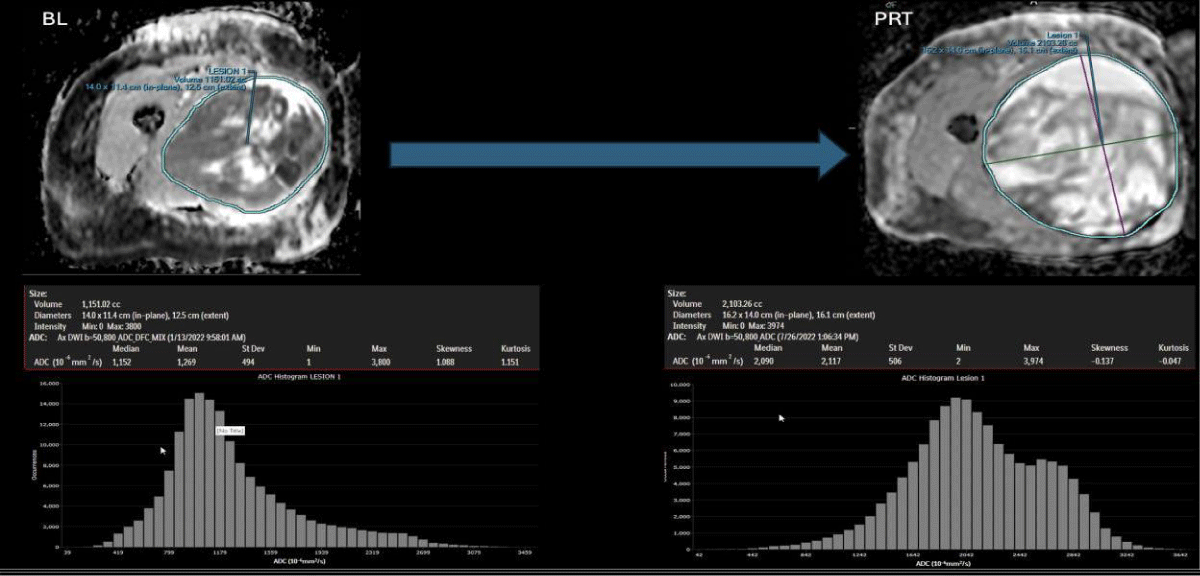
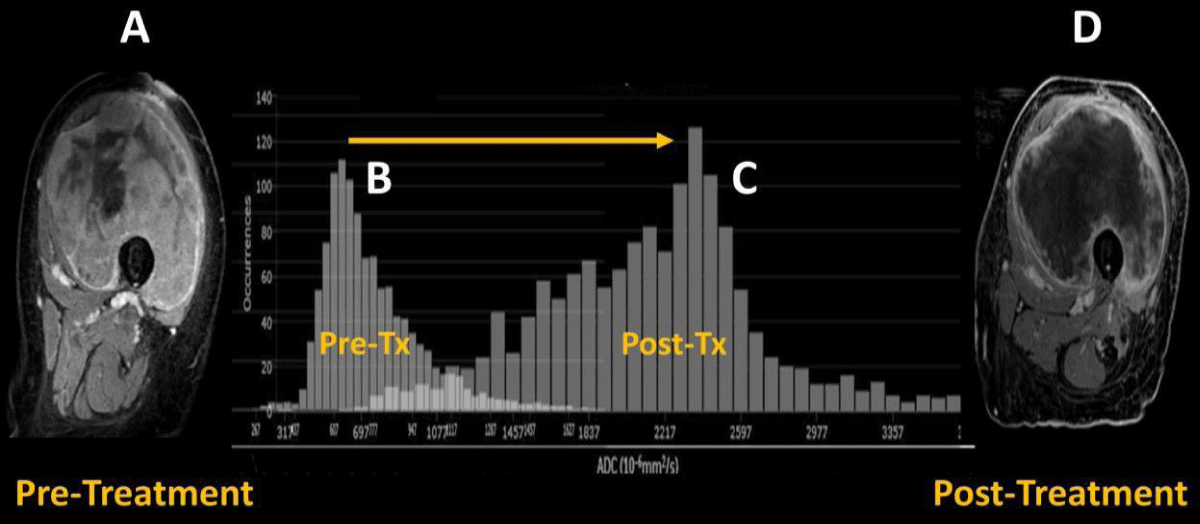
DWI is a non-invasive functional MRI sequence sensitive to the density of tumor cells within STS. By probing the random movement of water molecules, DWI is able to characterize the cellularity of malignant tumors, which generally have fewer extracellular spaces and smaller cytoplasm than benign tissues [13,19,20. To quantify the degree of diffusion, the Apparent Diffusion Coefficient (ADC) values can be computed using either a simple mono-exponential model or more sophisticated models [20,21]. The restricted diffusion in malignancies generally results in lower ADC values, which can help distinguish them from benign lesions, which typically demonstrate higher ADC values [5]. Effective therapy resulting in cell death increases water diffusion and higher ADC values. ADC values are inversely correlated with the Ki67 labeling index (a tumor cell division rate measure, typically considered high above 30), displaying a low mean in high proliferation groups [12,22]. DWI/ADC has demonstrated value as a potential biomarker of response in sarcoma patients treated with preoperative radiation therapy [5,23,24]. Patients with successful responses to treatment (> = 90% PATE) typically present a post-therapeutic right-sided ADC histogram with negative skewness (Figures 1,2) and higher ADC mean than poor responders [5,25]. Tumor changes at the cellular level occur before morphologic changes, making DWI/ADC a potential prognostic tool if performed early in treatment [24-27].
Figure 1: Case of pseudo-progression in a good-responder case: At the left panels, BL: Baseline/pre-treatment UPS ADC map, displaying central necrosis, a peripheral solid restricting tumor, and a left-sided intensity histogram. At the right panels and after completing 6 months of systemic therapy and radiation therapy (PRT: Post-Radiation Therapy), the tumor demonstrates a significant increase in volume (pseudo-progression), reduction in the solid diffusion restricting tumor, increase in mean ADC (from 1.2 to 2.1 x 10⁻³/mm2, reduction in skewness (from 1.0 to - 0.14) and an overall right-sided displaced histogram.
Figure 2: Pre-therapeutic contrast-enhanced MRI of UPS of the left thigh (A) with predominant solid internal enhancement and corresponding left-sided ADC histogram (B) with positive skewness. Post-therapeutic contrast-enhanced MRI of the same lesion (D) demonstrating highly diminished solid enhancement and corresponding right-sided ADC histogram (C) with negative skewness. The figure was modified with permission from the authors, Valenzuela, R.F. et al. [2].
Purpose
To demonstrate that DWI/ADC MRI and higher order radiomics can be valuable clinical imaging tools to reliably assess treatment response in extremity UPS patients, outperforming traditional size-based and volumetric treatment assessment metrics.
General disclosures and statements: Methodology
All included data collection, management, and processing methods were performed by all the institutional and generally accepted relevant clinical and research guidelines and regulations.
Data availability: The datasets used and/or analyzed during the current study are readily available from the corresponding author upon reasonable request.
IRB and waiver of consent: Due to the study’s retrospective nature, The UT MD Anderson Cancer Center Institutional Review Board waived the need to obtain informed consent (IRB identifier PA16-0857 Protocol Name: “Utility of imaging of bone and soft tissue tumors and disease and treatment-related changes for diagnosis, prognosis, treatment response, and outcome”).
Patient population, patient inclusion, and exclusion
The study included the analysis of 5,135 MRI scans performed for extremity STS in our institutional 29-magnet fleet (consisting of 1.5T and 3.0T scanners from two manufacturers) between February 2021 and May 2023. Within this time range, 643 UPS studies were completed, including preoperative primary tumor assessment and post-operative surveillance studies. We excluded all post-operative surveillance and primary myxoid-UPS cases, yielding 33 extremity cases undergoing surgical resection and at least one preoperative MR within the defined time range. Our study population of 33 patients ranged in age from 36 to 85 years old (average age of 64 years old, Table 1).
| Table 1: Extremity UPS patient population characteristics. PATE: Pathology-Assessed Treatment Effect. | |
| Total Patients Included in the Study | 33 |
| Total Male | 20 (61%) |
| Total Female | 13 (39%) |
| Average Age | 64 years (range 36 years - 85 years) |
| Responders (> = 90% PATE) | 16 |
| Partial Responders (Between 89% and 31% PATE) | 10 |
| Non-Responders (< = 30% PATE) | 7 |
| Patients with External Baseline Studies | 10 |
| Patients with Advanced Baseline Studies | 23 |
| Patients with Advanced Post-Chemo Studies | 15 |
| Patients with Advanced Post-Radiation Studies | 30 |
Twenty were male (61%) and 13 were female (39%). Patients were categorized into three groups based on the surgical specimen’s PATE percentage. Tumors demonstrating over 90% PATE were classified as responders (R, n = 16), tumors with a PATE in the 31% - 89% range were labeled as partial responders (PR, n = 10), and tumors with a PATE of 30% or less were considered non-responders (NR, n = 7). Of the 33 patients, 10 underwent BL MRI studies outside our institution without DWI/ADC, while their subsequent PC and PRT MRIs were obtained at our institution. These 10 Baseline (BL) patients were excluded from the ADC analysis although included for the conventional size-based RECIST, WHO, and volume analysis. For the remaining 23 patients, a complete set of advanced MRI studies, including PC and/or PRT, was performed at our institution. For the DWI/ADC analysis, 23 patients were included in the B.L. group, 15 in the PC group, and 30 in the PRT group (Table 1). Eighteen patients did not receive systemic chemotherapy, and three did not receive neoadjuvant radiotherapy before surgical excision. Therefore, they were excluded from the PC and PRT analyses, respectively.
MRI tailoring and schedule
At our institution, we performed functional MRI sequences, including DWI/ADC, CE-SWI, and PWI/DCE [5,9]. Parameters were tailored according to MRI vendor and field strength. During the preoperative treatment, multiple scans were acquired for each patient and compiled into three time points: Baseline (BL, pre-therapy), post-systemic chemotherapy (PC), and preoperative/post-radiation (PRT) time points. For STS, we conducted a pre-therapy baseline study, one to three MRIs during systemic chemotherapy, and at least one post-radiation study one to two months after radiation therapy and immediately before surgical resection. ADC-derived metrics were compared at different time points against the standard references, including 1) Pathology-Assessed Treatment Effect (PATE) on surgical specimens and 2) Conventional tumor treatment size-based metrics such as RECIST, WHO, and volume.
Image storage and post-processing
The acquired MR images were transferred to the institutional Picture Archiving and Communication System (PACS) (IntelliSpace PACS, Philips, Amsterdam, Netherlands). For analyses, the images were first retrieved from PACS, and then the entire tumor volume was contoured manually by a trained research assistant, yielding a tumor volume of interest (VOI). MIM software (MIM Software Inc., Cleveland, USA) was used to outline, process, and generate VOIs from ADC images. The segmented tumor volume files were exported as DICOM RT-Struct files [28] to an institutional network storage drive. An in-house developed Cancer Radiomic and Perfusion Imaging (CARPI) automated framework [16], capable of intensity histogram-based first-order and high-order radiomic feature extraction from advanced MRI sequences, processed all the RT-Struct files containing segmented VOI data. Before radiomic feature extraction, all images were preprocessed in CARPI by performing B-spline interpolation to isotropic voxel spacing of 1 mm and discretization using a fixed histogram bin count of 50 [29]. CARPI extracted 107 radiomic features using the Pyradiomics 3.0.1 Python library [30], including shape (14 features), first-order statistics (18 features), and texture (75 features), and automatically recorded them in a Database Management System (DBMS) based on PostgreSQL (The PostgreSQL Global Development Group, Berkeley, USA).
Reference standard RECIST, WHO, and volume
All 33 patients were analyzed for RECIST, WHO, and volumetric measurements. Conventional tumor size metrics for all three orthogonal planes were registered for all time points (BL, PC, and PRT) and used to estimate RECIST, WHO, and volumetric assessment metrics. Maximum diameter, area, and volume were measured at PC and PRT concerning BL, comparing responders and partial/non-responders. RECIST, WHO, and volume criteria for partial response (P.R.) threshold were set at 30%, 50%, and 50% decrease, respectively. Progressive disease (P.D.) threshold was set at 20%, 25%, and 25% increase, respectively [31]. All responders and partial/non-responders displayed tumor size changes at the Post-Radiation (PRT) time point when compared to their respective baseline (BL), which fall within the range of stability, i.e., between +20% and -30% for RECIST and +25% and -50% for WHO and volume. All partial/non-responders demonstrated pseudo-progression at PC, crossing the threshold of +20% for RECIST and +25% for WHO and volume assessments. Similarly, all responders presented WHO and volumetric pseudo-progression at the post-chemotherapy time point (PC).
Reference standard PATE
The 33 patients were categorized into three groups based on the surgical specimen’s PATE percentage. Tumors demonstrating equal to or greater than 90% PATE were classified as Responders (R), tumors with a PATE in the 31% - 89% range were labeled as Partial Responders (PR), and tumors with a PATE of 30% or less were considered non-responders (NR). The three groups were compared, including 16 subjects in the R group, 10 in the PR group, and 7 in the NR group (Table 1). The combined PR/NR group had 17 subjects.
Radiomic analysis
First-order radiomic features computed from ADC maps, including mean, skewness, kurtosis, 10th percentile proportion, and 90th percentile proportion, were statistically compared in R and PR/NR at PC and PRT in reference to BL. The 10th and 90th percentile proportions were obtained by computing the percentage of ADC values below the 10th and above the 90th percentiles from the BL ADC histogram, respectively. Statistical analyses were performed independently at BL, PC, and PRT, comparing 107 first- and high-order ADC map-derived radiomic features in R vs. PR/NR. All statistical analyses were performed using two-tailed non-parametric Wilcoxon rank-sum tests, with statistical significance assessed at the 5% level (p < 0.05). The statistical analysis was implemented in Python 3.10.13 using the SciPy library version 1.12.0 [32].
ADC first-order radiomics across treatment
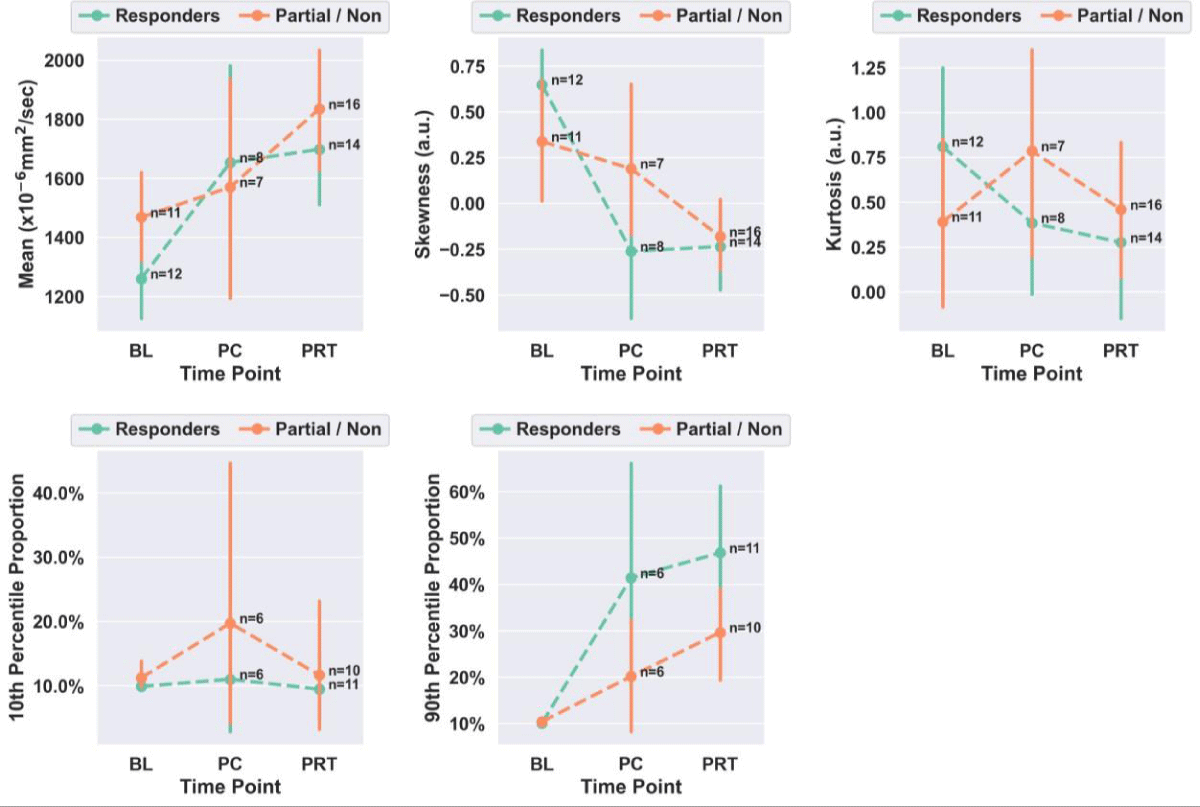
Figure 3 presents the first-order radiomic trends observed in R and PR/NR. Table 2 summarizes the statistical results comparing PC and PRT relative to BL in R and PR/NR. At the PC time point, responders displayed a 31% increase in ADC mean (p = 0.0253), 140% decrease in skewness (p = 0.0034), and a 310% increase in 90th percentile proportion (p = 0.0246), with respect to BL. Subsequently, at the PRT time point, responders presented a 35% increase in ADC mean (p = 0.0034), 136% decrease in skewness (p = 0.0001), and a 363% increase in 90th percentile proportion (p = 0.0009), with respect to BL Finally, at PRT vs. BL, partial/non-responders displayed a 25% increase in ADC mean (p = 0.0136), 154% decrease in skewness (p = 0.0136), 4% increase in 10th percentile proportion (p = 0.0257), and a 184% increase in 90th percentile proportion (p = 0.0257).
Figure 3: Scatter plots of ADC mean, skewness, kurtosis, and 10th and 90th percentile proportions at baseline (BL) vs. post-chemo (PC) vs. post-radiation therapy (PRT) in responders and partial/non-responders. Each point in the plot represents the group mean with a 95% confidence interval. a.u.: Arbitrary Units.
| Table 2: Summary of trends in ADC mean, skewness, kurtosis, 10th and 90th percentile proportion at Post-Chemo (PC) and Post-Radiation Therapy (PRT) with respect to baseline (BL) in responders and partial/non-responders. Note: All p-values resulted from two-tailed non-parametric Wilcoxon rank-sum statistical tests. | ||||||
| Mean Delta | Skewness Delta | Kurtosis Delta | 10th Percentile Delta | 90th Percentile Delta | ||
| Responders | PC vs. BL | +31% (p = 0.0253) | -140% (p = 0.0034) | -52% (p = 0.3159) | +11% (p = 0.3490) | +310% (p = 0.0246) |
| PRT vs. BL | +35% (p = 0.0034) | -136% (p = 0.0001) | -66% (p = 0.1228) | -4% (p = 0.7119) | +363% (p = 0.0009) | |
| Partial/Non- Responders | PC vs. BL | +7% (p = 0.2576) | -44% (p = 0.4414) | +101% (p = 0.3416) | +76% (p = 0.8283) | +93% (p = 0.2781) |
| PRT vs. BL | +25% (p = 0.0136) | -154% (p = 0.0136) | +17% (p = 0.8823) | +4% (p = 0.0257) | +184% (p = 0.0257) | |
ADC first- and high-order radiomics in responders vs. partial/non-responders
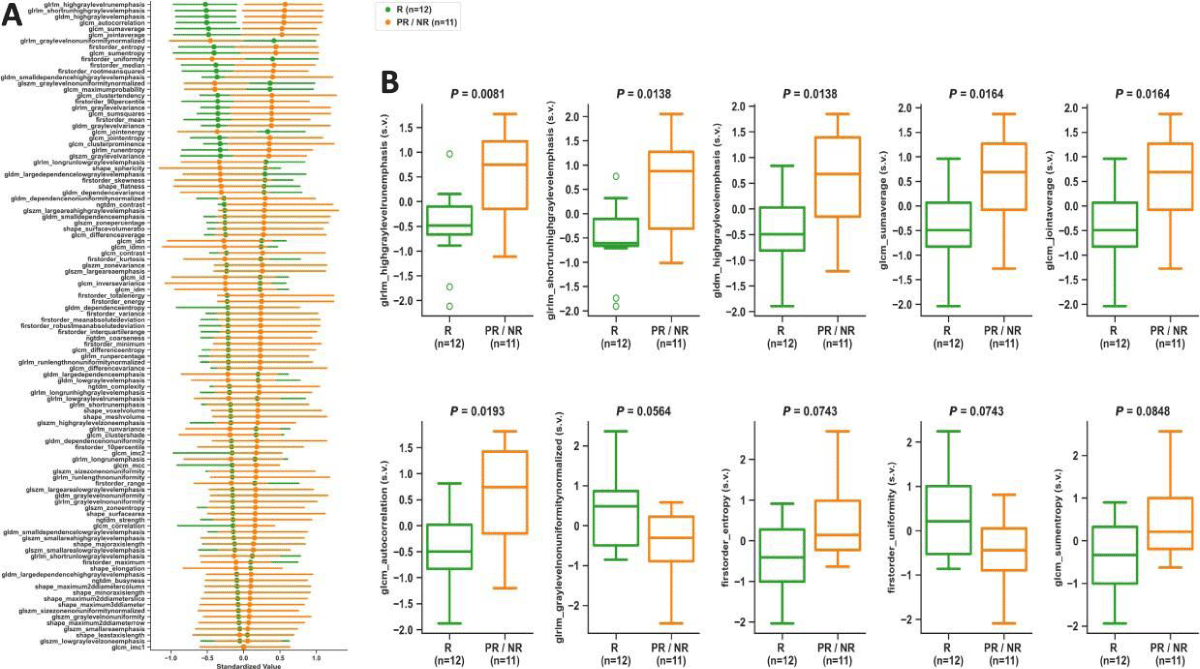
Figures 4,5 summarize the statistical findings on 107 radiomic features comparing R vs. PR/NR at BL and PC, respectively. At the BL time point, glrlm_highgraylevelrunemphasis (p = 0.0081), glrlm_shortrunhighgraylevelemphasis (p = 0.0138), gldm_highgraylevelemphasis (p = 0.0138), glcm_sumaverage (p = 0.0164), glcm_jointaverage (p = 0.0164), and glcm_autocorrelation (p = 0.0193) provided statistically significant differences between R and PR/NR. At the PC time point, firstorder_meanabsolutedeviation (p = 0.0078),firstorder_interquartilerange (p = 0.0109), firstorder_variance (p = 0.0109), and firstorder_robustmeanabsolutedeviation (p = 0.0151) provided statistically significant differences between R and PR/NR. No statistically significant differences were observed in R vs. PR/NR at PRT.
Figure 4: Baseline time point analysis. ADC map radiomics scatter plot (A) showing means with 95% confidence intervals sorted from largest to smallest differences between R and PR/NR, and boxplots (B) of top 10 radiomic features comparing R vs. PR/NR. All p - values resulted from two-tailed non-parametric Wilcoxon rank-sum tests. s.v.: Standardized Value; R: Responders; PR/NR: Partial/Non-Responders.
Figure 5: Post-chemotherapy time point analysis. ADC map radiomics scatter plot (A) showing means with 95% confidence intervals sorted from largest to smallest differences between R and PR/NR, and boxplots (B) of top 10 radiomic features comparing R vs. PR/NR. All P-values resulted from two-tailed non-parametric Wilcoxon rank-sum tests. s.v.: Standardized Value; R: Responders; PR/NR: Partial/Non-Responders.
In this study, functional MR imaging, including DWI/ADC, was performed on 33 extremity UPS patients, categorized into responders (n = 16) and partial/non-responders (n = 17) based on PATE. 107 radiomic features were automatically extracted from ADC maps and statistically analyzed, comparing responders vs. partial/non-responders across the BL, PC, and PRT time points in the patient’s systemic treatment. The potential of ADC-derived radiomic features for predicting a patient’s response to treatment was compared against the RECIST, WHO, and volumetric traditional response criteria.
Pseudo-progression and traditional response criteria
Pseudo-progression occurs when a tumor enlarges, followed by a decrease in size without changes in therapy or evidence of progression in subsequent imaging or pathological assessments [9,33]. It can occur in up to 10% of STS responders and 30% of patients with intermediate responses. Tumor volume may increase up to 40% post-radiation, and some cases may display an increase in volume despite showing 95% tumor necrosis [34]. Hence, an increase in tumor size during preoperative radiotherapy for STS does not necessarily indicate a lack of response [35]. Our findings demonstrated a high prevalence of pseudo-progression at PC and universal stability at PRT in both R and PR/NR based on traditional response assessments, indicating that RECIST, WHO, and volumetric measurements are unreliable for predicting histopathological effects, differentiating between R and PR/NR, and assessing overall therapeutic effectiveness (Figure 2).
First-order radiomic analysis across patient treatment
Our results indicated that from BL to PRT, the ADC mean significantly increased by 35% in responders, consistent with previously reported findings [5,24,25]. This increase in ADC mean was accompanied by a significant reduction in skewness (-136%) and a significant increase in the 90th percentile proportion (+363%). Moreover, these changes were also observed in responders when comparing PC vs. BL. In summary, the post-therapeutic first-order radiomic trends displayed by responders, including high ADC mean, low skewness, and high 90th percentile proportion, agreed with the right-sided displacement of the ADC histogram (Figure 2) typically observed in successfully treated UPS with > = 90% PATE [5].
Radiomics-based discrimination of responders vs. partial/non-responders
The statistical analysis performed on the 107 first- and high-order radiomic features comparing R vs. PR/NR displayed 6 high-order texture features significantly lower in R vs. PR/NR in reference to BL time point. Additionally, our results revealed 4 first-order features significantly higher in R vs. PR/NR at the PC time point. Therefore, these radiomic features could potentially represent novel pre-treatment and post-therapeutic imaging biomarkers of response in UPS patients. Nevertheless, subsequent studies will be needed to validate these findings.
Study limitations
The present study was mainly limited by the sample size (n = 33). Ongoing research efforts in our institution are tailored towards increasing the number of UPS patients imaged with DWI/ADC MRI to generate a more diverse and larger database for further analysis and validation.
The first- and high-order radiomic features based on DWI/ADC MRI demonstrate the potential to outperform traditional size-based response criteria in predicting treatment effectiveness for Undifferentiated Pleomorphic Sarcoma (UPS). In particular, high post-therapeutic ADC mean, low skewness, and high 90th percentile proportion compared to the baseline measurements can predict successfully treated UPS patients presenting 90% or higher PATE.
- The John S. Dunn, Sr. Distinguished Chair in Diagnostic Imaging.
- M.R. Evelyn Hudson Foundation Endowed Professorship.
- DeLaney TF, et al. Soft tissue sarcomas, in Treatment of cancer. 2020; 434-458.
- Gamboa AC, Gronchi A, Cardona K. Soft-tissue sarcoma in adults: An update on the current state of histiotype-specific management in an era of personalized medicine. CA Cancer J Clin. 2020;70(3):200-229. Available from: https://pubmed.ncbi.nlm.nih.gov/32275330/
- Sbaraglia M, Bellan E, Dei Tos AP. The 2020 WHO Classification of Soft Tissue Tumours: news and perspectives. Pathologica. 2021;113(2):70-84. Available from: https://pubmed.ncbi.nlm.nih.gov/33179614/
- Robles-Tenorio A, Solis-Ledesma G. Undifferentiated Pleomorphic Sarcoma. 2023 Apr 10. In: StatPearls [Internet]. Treasure Island (FL): 2024; 34033374. Available from: https://pubmed.ncbi.nlm.nih.gov/34033374/
- Valenzuela RF, Amini B, Duran-Sierra E, Canjirathinkal MA, Madewell JE, Costelloe CM, et al. Multiparametric MRI for the Assessment of Treatment Effect and Tumor Recurrence in Soft-tissue Sarcoma of the Extremities. J Radiol Oncol. 2023;7(3):058-065. Available from: https://www.radiooncologyjournal.com/articles/jro-aid1055.php
- Jo VY, Fletcher CD. WHO classification of soft tissue tumours: an update based on the 2013 (4th) edition. Pathology. 2014;46(2):95-104. Available from: https://pubmed.ncbi.nlm.nih.gov/24378391/
- Roberge D, Skamene T, Nahal A, Turcotte RE, Powell T, Freeman C. Radiological and pathological response following pre-operative radiotherapy for soft-tissue sarcoma. Radiother Oncol. 2010;97(3):404-7. Available from: https://pubmed.ncbi.nlm.nih.gov/21040989/
- Eisenhauer EA, Therasse P, Bogaerts J, Schwartz LH, Sargent D, Ford R, et al. New response evaluation criteria in solid tumours: revised RECIST guideline (version 1.1). Eur J Cancer. 2009;45(2):228-47. Available from: https://pubmed.ncbi.nlm.nih.gov/19097774/
- Valenzuela RF, Kundra V, Madewell JE, Costelloe CM. Advanced Imaging in Musculoskeletal Oncology: Moving Away From RECIST and Embracing Advanced Bone and Soft Tissue Tumor Imaging (ABASTI) - Part I - Tumor Response Criteria and Established Functional Imaging Techniques. Semin Ultrasound CT MR. 2021;42(2):201-214. Available from: https://pubmed.ncbi.nlm.nih.gov/33814106/
- Wardelmann E, Haas RL, Bovée JV, Terrier P, Lazar A, Messiou C, et al. Evaluation of response after neoadjuvant treatment in soft tissue sarcomas; the European Organization for Research and Treatment of Cancer-Soft Tissue and Bone Sarcoma Group (EORTC-STBSG) recommendations for pathological examination and reporting. Eur J Cancer. 2016;53:84-95. Available from: https://pubmed.ncbi.nlm.nih.gov/26700077/
- Soldatos T, Ahlawat S, Montgomery E, Chalian M, Jacobs MA, Fayad LM. Multiparametric Assessment of Treatment Response in High-Grade Soft-Tissue Sarcomas with Anatomic and Functional MR Imaging Sequences. Radiology. 2016;278(3):831-40. Available from: https://pubmed.ncbi.nlm.nih.gov/26390048/
- Subhawong TK, Wilky BA. Value added: functional MR imaging in management of bone and soft tissue sarcomas. Curr Opin Oncol. 2015;27(4):323-31. Available from: https://pubmed.ncbi.nlm.nih.gov/26049272/
- Koh DM, Collins DJ. Diffusion-weighted MRI in the body: applications and challenges in oncology. AJR Am J Roentgenol. 2007;188(6):1622-35. Available from: https://pubmed.ncbi.nlm.nih.gov/17515386/
- Einarsdóttir H, Karlsson M, Wejde J, Bauer HC. Diffusion-weighted MRI of soft tissue tumours. Eur Radiol. 2004;14(6):959-63. Available from: https://pubmed.ncbi.nlm.nih.gov/14767604/
- Halefoglu AM, Yousem DM. Susceptibility weighted imaging: Clinical applications and future directions. World J Radiol. 2018;10(4):30-45. Available from: https://pubmed.ncbi.nlm.nih.gov/29849962/
- Martín-Noguerol T, Montesinos P, Casado-Verdugo OL, Beltrán LS, Luna A. Susceptibility Weighted Imaging for evaluation of musculoskeletal lesions. Eur J Radiol. 2021;138:109611. Available from: https://pubmed.ncbi.nlm.nih.gov/33677418/
- Padhani AR. Dynamic contrast-enhanced MRI in clinical oncology: current status and future directions. J Magn Reson Imaging. 2002;16(4):407-22. Available from: https://pubmed.ncbi.nlm.nih.gov/12353256/
- Huang W, Beckett BR, Tudorica A, Meyer JM, Afzal A, Chen Y, et al. Evaluation of Soft Tissue Sarcoma Response to Preoperative Chemoradiotherapy Using Dynamic Contrast-Enhanced Magnetic Resonance Imaging. Tomography. 2016;2(4):308-316. Available from: https://pubmed.ncbi.nlm.nih.gov/28066805/
- Messina C, Bignone R, Bruno A, Bruno A, Bruno F, Calandri M, et al. Diffusion-Weighted Imaging in Oncology: An Update. Cancers (Basel). 2020;12(6):1493. Available from: https://pubmed.ncbi.nlm.nih.gov/32521645/
- Bammer R. Basic principles of diffusion-weighted imaging. Eur J Radiol. 2003;45(3):169-84. Available from: https://pubmed.ncbi.nlm.nih.gov/12595101/
- Le Bihan D. Apparent diffusion coefficient and beyond: what diffusion MR imaging can tell us about tissue structure. Radiology. 2013;268(2):318-22. Available from: https://pubmed.ncbi.nlm.nih.gov/23882093/
- Lee JH, Yoon YC, Seo SW, Choi YL, Kim HS. Soft tissue sarcoma: DWI and DCE-MRI parameters correlate with Ki-67 labeling index. Eur Radiol. 2020;30(2):914-924. Available from: https://pubmed.ncbi.nlm.nih.gov/31630234/
- Sierra ED, Valenzuela R, Canjirathinkal MA, Costelloe CM, Moradi H, Madewell JE, et al. Cancer Radiomic and Perfusion Imaging Automated Framework: Validation on Musculoskeletal Tumors. JCO Clin Cancer Inform. 2024;8:e2300118. Available from: https://pubmed.ncbi.nlm.nih.gov/38181324/
- Duran-Sierra EVR, Canjirathinkal M, Murphy W, Madewell J, Costelloe C, Amini B. Apparent Diffusion Coefficient (ADC) High-Order Radiomics of Baseline and Post-treatment Advanced MRI of extremity Soft-Tissue Undifferentiated Pleomorphic Sarcoma, in ECR 2023. 2023.
- Drapé JL. Advances in magnetic resonance imaging of musculoskeletal tumours. Orthop Traumatol Surg Res. 2013;99(1 Suppl):S115-23. Available from: https://pubmed.ncbi.nlm.nih.gov/23380432/
- Dudeck O, Zeile M, Pink D, Pech M, Tunn PU, Reichardt P, et al. Diffusion-weighted magnetic resonance imaging allows monitoring of anticancer treatment effects in patients with soft-tissue sarcomas. J Magn Reson Imaging. 2008;27(5):1109-13. Available from: https://pubmed.ncbi.nlm.nih.gov/18425832/
- Winfield JM, Miah AB, Strauss D, Thway K, Collins DJ, deSouza NM, et al. Utility of Multi-Parametric Quantitative Magnetic Resonance Imaging for Characterization and Radiotherapy Response Assessment in Soft-Tissue Sarcomas and Correlation With Histopathology. Front Oncol. 2019;9:280. Available from: https://pubmed.ncbi.nlm.nih.gov/31106141/
- Law MY, Liu B. Informatics in radiology: DICOM-RT and its utilization in radiation therapy. Radiographics. 2009;29(3):655-67. Available from: https://pubmed.ncbi.nlm.nih.gov/19270073/
- van Timmeren JE, Cester D, Tanadini-Lang S, Alkadhi H, Baessler B. Radiomics in medical imaging-"how-to" guide and critical reflection. Insights Imaging. 2020;11(1):91. Available from: https://pubmed.ncbi.nlm.nih.gov/32785796/
- van Griethuysen JJM, Fedorov A, Parmar C, Hosny A, Aucoin N, Narayan V, et al. Computational Radiomics System to Decode the Radiographic Phenotype. Cancer Res. 2017;77(21):e104-e107. Available from: https://pubmed.ncbi.nlm.nih.gov/29092951/
- Subhawong TK, Feister K, Sweet K, Alperin N, Kwon D, Rosenberg A, et al. MRI Volumetrics and Image Texture Analysis in Assessing Systemic Treatment Response in Extra-Abdominal Desmoid Fibromatosis. Radiol Imaging Cancer. 2021;3(4):e210016. Available from: https://pubmed.ncbi.nlm.nih.gov/34213370/
- Virtanen P, Gommers R, Oliphant TE, Haberland M, Reddy T, Cournapeau D, et al. SciPy 1.0: fundamental algorithms for scientific computing in Python. Nat Methods. 2020;17(3):261 -272. Epub 2020 Feb 3. Erratum in: Nat Methods. 2020;17(3):352. Available from: https://pubmed.ncbi.nlm.nih.gov/32015543/
- Nishino M, Hatabu H, Hodi FS. Imaging of Cancer Immunotherapy: Current Approaches and Future Directions. Radiology. 2019;290(1):9-22. Available from: https://pubmed.ncbi.nlm.nih.gov/30457485/
- Fields BKK, Hwang D, Cen S, Desai B, Gulati M, Hu J, Duddalwar V, Varghese B, Matcuk GR Jr. Quantitative magnetic resonance imaging (q-MRI) for the assessment of soft-tissue sarcoma treatment response: a narrative case review of technique development. Clin Imaging. 2020;63:83-93. Available from: https://pubmed.ncbi.nlm.nih.gov/32163847/
- Miki Y, Ngan S, Clark JC, Akiyama T, Choong PF. The significance of size change of soft tissue sarcoma during preoperative radiotherapy. Eur J Surg Oncol. 2010;36(7):678-83. Available from: https://pubmed.ncbi.nlm.nih.gov/20547446/
