
More Information
Submitted: June 11, 2024 | Approved: June 21, 2024 | Published: June 24, 2024
How to cite this article: Li S, Zhao S, Dai Y, He Y, Yang H, et al. MRI-based Tumor Habitat Analysis for Treatment Evaluation of Radiotherapy on Esophageal Cancer. J Radiol Oncol. 2024; 8: 055-063.
DOI: 10.29328/journal.jro.1001065
Copyright License: © 2024 Li S, et al. This is an open access article distributed under the Creative Commons Attribution License, which permits unrestricted use, distribution, and reproduction in any medium, provided the original work is properly cited.
Keywords: Habitat imaging; Esophageal cancer; MRI; Treatment evaluation

MRI-based Tumor Habitat Analysis for Treatment Evaluation of Radiotherapy on Esophageal Cancer
Shaolei Li1#, Shengguang Zhao2#, Yongming Dai3, Yida He6, Hongcheng Yang6, Xuekun Zhang4, Xiaoyan Chen5, Weixiang Qi2, Mei Chen2, Yibin Zhang2, Jiayi Chen2, Fuhua Yan1,4, Zenghui Cheng4* and Yingli Yang1*
1Institute for Medical Imaging Technology, Ruijin Hospital, Shanghai, China
2Department of Radiation Oncology, Ruijin Hospital, Shanghai, China
3School of Biomedical Engineering, ShanghaiTech, Shanghai, China
4Department of Radiology, Ruijin Hospital, Shanghai, China
5Department of Pathology. Ruijin Hospital, Shanghai, China
6United Imaging, Shanghai, China
#These authors contributed equally
*Address for Correspondence: Yingli Yang, Institute for Medical Imaging Technology, Ruijin Hospital, Shanghai, China, Email: yyl12092@rjh.com.cn
Zenghui Cheng, Department of Radiology, Ruijin Hospital, Shanghai, China, Email: czh12048@rjh.com.cn
Introduction: We aim to evaluate the performance of pre-treatment MRI-based habitat imaging to segment tumor micro-environment and its potential to identify patients with esophageal cancer who can achieve pathological complete response (pCR) after neoadjuvant chemoradiotherapy (nCRT).
Material and methods: A total of 18 patients with locally advanced esophageal cancer (LAEC) were recruited into this retrospective study. All patients underwent MRI before nCRT and surgery using a 3.0 T scanner (Ingenia 3.0 CX, Philips Healthcare). A series of MR sequences including T2-weighted (T2), diffusion-weighted imaging (DWI), and Contrast Enhance-T1 weighted (CE-T1) were performed. A clustering algorithm using a two-stage hierarchical approach groups MRI voxels into separate clusters based on their similarity. The t-test and receiver operating characteristic (ROC) analysis were used to evaluate the predictive effect of pCR on habitat imaging results. Cross-validation of 18 folds is used to test the accuracy of predictions.
Results: A total of 9 habitats were identified based on structural and physiologic features. The predictive performance of habitat imaging based on these habitat volume fractions (VFs) was evaluated. Students’ t-tests identified 2 habitats as good classifiers for pCR and non-pCR patients. ROC analysis shows that the best classifier had the highest AUC (0.82) with an average prediction accuracy of 77.78%.
Conclusion: We demonstrate that MRI-based tumor habitat imaging has great potential for predicting treatment response in LAEC. Spatialized habitat imaging results can also be used to identify tumor non-responsive sub-regions for the design of focused boost treatment to potentially improve nCRT efficacy.
Esophageal cancer (EC) is one of the deadliest cancers worldwide due to its aggressive nature and low survival rates. Esophageal cancer causes the sixth leading cancer-related mortality and is the eighth most common cancer in the world [1,2]. The overall 5-year survival rate of esophageal cancer in China was 40.1% based on a pooled analysis of hospital-based studies from 2000 to 2018 [3]. There are two histologic subtypes of esophageal cancer: squamous cell carcinoma (SCC) and adenocarcinoma (AC). The incidence of both subtypes varies geographically: AC has been the major type in some Western countries; in Asia, SCC is the predominant subtype and AC remains rare [4-7].
Currently, surgery remains the predominant approach for treating esophageal cancer. Nonetheless, the invasive nature of surgery leads to suboptimal long-term outcomes when used as a standalone treatment. Additionally, a considerable number of EC patients (more than 80%) receive a late-stage diagnosis, rendering them ineligible for surgery [8]. Consequently, there is a need to explore less invasive alternative therapies, particularly for early-stage patients. The combination of preoperative neoadjuvant chemoradiotherapy (nCRT) and surgery has emerged as the gold standard treatment for locally advanced esophageal cancer (LAEC) patients. However, these patients still have poor treatment prognoses, with surgical complications being a primary contributing factor. Esophagectomy is associated with a postoperative complication rate of up to 59% [9], a mortality rate of up to 4.2% [10], and a significant impact on quality of life. Studies have shown that nCRT improves both overall survival and disease-free survival in stage II and III esophageal cancer patients, with 17% to 49% achieving complete pathological response (pCR) after treatment [11,12]. These promising pCR rates provide the basis for considering a wait-and-watch surveillance strategy, which could potentially spare patients from the complications of surgery. Therefore, accurate prediction of which patients can avoid surgery or require immediate surgical intervention becomes crucial.
In addition, the use of localized high-dose radiotherapy (RT) boost to poorly-responding tumor sub-volumes is expected to improve the success rate of nCRT while minimizing the side effects associated with increasing the overall nCRT dose [13]. It is well-known that different patients and sub-volumes of a given tumor respond differently to the same RT dose, revealing remarkably heterogeneous underlying tumor biology [14,15]. However, in the current radiotherapy paradigm, variations in dose response at the sub-volume level are often overlooked, preventing flexible adjustment of dose distribution. By taking into account this variation, it becomes possible to administer a higher dose to resistant sub-volumes, avoiding overdose to the entire tumor. Therefore, it is crucial to develop a reliable non-invasive method to assess the heterogeneity within the tumor, which would enable radiation oncologists to implement personalized nCRT strategies and maximize the rate of pCR.
Thanks to advancements in radiology, medical imaging techniques are gaining increasing attention in the prediction and monitoring of treatment responses. Researchers are exploring predictive models based on 18F-FDG PET/CT and Magnetic Resonance Imaging (MRI) [16] as well as radiomics [17,18]. Some most recent studies have achieved considerable results. For example, Lu et al. used MRI radiomics to predict the response of neoadjuvant chemotherapy (NACT) with AUC reaching 0.781 [19]. However, radiomics lacks interpretability and individual biomarkers like ADC may not sufficiently characterize the tumor micro-environment.
A recent method called habitat imaging, which utilizes multi-parametric MRI data, has emerged to measure intra-tumoral heterogeneity [20]. This technique partitions the tumor microenvironment into distinct sub-regions with similar characteristics. Habitat imaging has been widely used in various aspects of tumor treatment, including predicting survival rate [21], recurrence [22], and tumor progression sites [23] for glioblastoma and breast cancer. The results of these studies demonstrated the effectiveness of habitat imaging in predicting treatment response and measuring heterogeneity.
In this study, we aim to evaluate the performance of habitat imaging analysis based on MR images in differentiating treatment response spatially within tumors and identifying pCR in esophageal cancer patients following nCRT.
The overall workflow is shown in Figure 1.
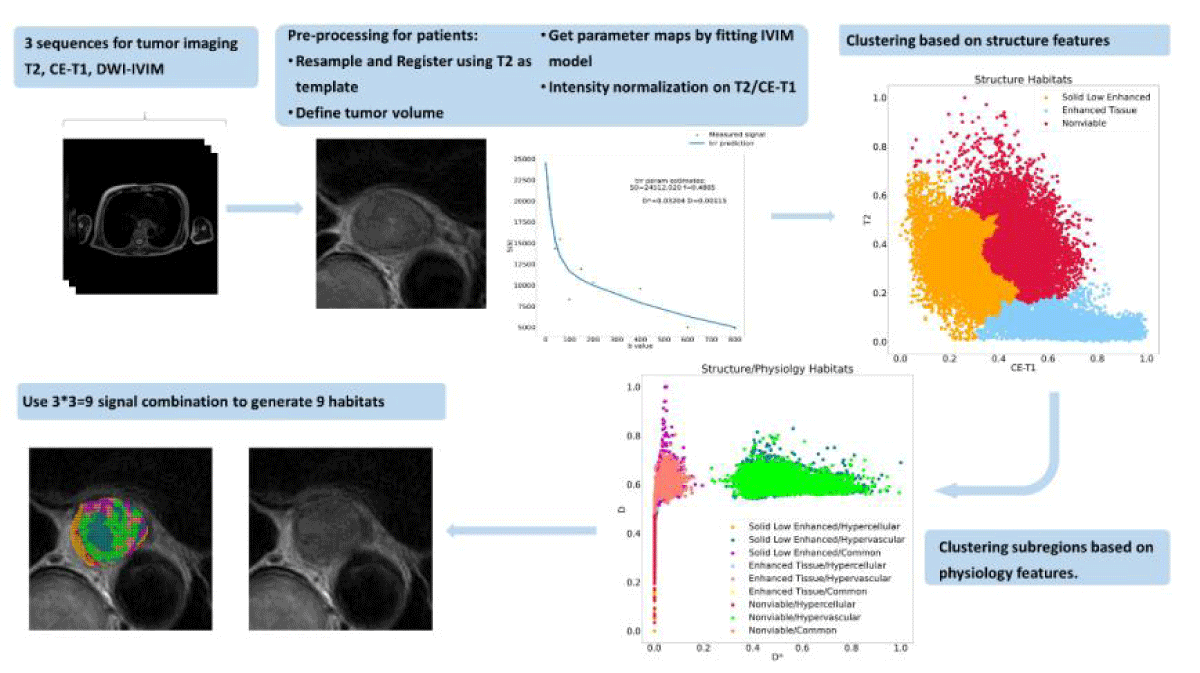
Figure 1: The process of generating tumor spatial habitats. Structural and physiologic features are obtained from MR signals. Each voxel was associated with the features. We classified each voxel within the tumor volume into 3 categories based on structural and then physiologic features via agglomerative clustering. Every voxel in the tumor volume can be identified uniquely. The resultant habitat map shows the spatial heterogeneity within the tumor.
Patients
A cohort of esophageal cancer patients who had undergone nCRT at Ruijin Hospital, Shanghai, China between 2021 and 2023 were retrospectively included in our study. The inclusion criteria are as follows: (1) receive pathological exams after surgery; (2) get the same baseline MRI scans; (3) no artifacts or too much distortion. From a total of 25 patients, we excluded 7 patients because of the poor quality of their MR images or cancellation of surgery.
Table 1 Characteristics of the patients and their statistics. TRG stands for Tumor regression grade, a classification of cancer response to preoperative treatment, which can predict a prognosis of survival [23,24]. Our grading system follows CAP/NCCN, Becker (4 categories) [25,26].
| Table 1: lists the characteristics of the 18 included patients. | ||
| Characteristics Age (years) | pCR (n = 11) 68.2 ± 5.7 | non pCR (n = 7) 65 ± 7.7 |
| Male | 9 | 5 |
| Female | 2 | 2 |
| Cancer Subtype | SCC | SCC |
| Cancer Stage | ||
| T3N1M0 | 7 | 4 |
| T3N2M0 | 4 | 2 |
| T2N0M0 | 0 | 1 |
| Pathology | ||
| TRG-0 | 11 | 0 |
| TRG- 1 | 0 | 5 |
| TRG-2 | 0 | 2 |
MRI protocol
For our cohort, all MRI scans were performed on a 3.0T scanner (Ingenia 3.0 CX, Philips Healthcare). The MRI examination comprised a series of sequences including contrast-enhanced T1-weighted (CE-T1), T2-weighted (T2), and diffusion-weighted imaging (DWI). The CE-T1 scans were acquired using the following settings: TR/TE: 3.538/0; slice thickness: 3 mm; flip angle: 10◦; matrix size: 512 × 512; and FOV: 45 cm × 45 cm. The T2 scans were acquired using the following settings: TR/TE: 2500.0/161.729; slice thickness: 4 mm; flip angle: 90◦; matrix size: 800 × 800; and FOV: 45 cm × 45 cm. The DWI scans were acquired using a spin-echo echo-planar imaging sequence with the following settings: TR/TE: 1248. 164/72.436; slice thickness: 4 mm; flip angle: 90◦; matrix size: 128 × 128; and FOV: 30 cm ×30 cm. 10 b-values (0, 20, 40, 60, 100, 150, 200, 400, 600, and 800 s/mm2) were applied. CT scans on a simulator (Brilliance Big Bore, Philips Healthcare) with contrast agents were also included to assist tumor segmentation. CT settings were as follows: slice thickness: 3 mm; matrix size: 768 × 768; FOV: 60 cm × 60 cm.
Preparation for features
Tumor segmentation and prepossessing: Tumor segmentation was performed on patients’ CT simulation images by radiation oncologists to create the Gross Tumor Volume (GTV). The standard procedure to create GTV is as follows: (a) the elementary segmentation of the tumor is made by junior radiation oncologists; (b) the segmentation is reviewed and revised by senior radiation oncologists with over 25 years of clinical experience. We used T2 as the primary image, CT and CE-T1 were both rigidly registered while DWI was deformably registered. GTVs were transferred to all sequences. A cubic region of interest (ROI) extending 20 mm around the GTV was manually cut. CE-T1 and DWI ROIs were resampled to the same isotropic resolution as T2 images using bilinear interpolation to account for resolution differences. All these preprocessing were implemented using a custom MIM workflow (MIM Software Inc., Cleveland, OH, USA).
In this study, there are two types of features: CE-T1 and T2 are called structural features; D and D* parameter maps are called physiologic features. Parameter maps were calculated from DWI images. Calculation details are explained in Section 2.3.2. Before habitat cluster analysis, structural and physiologic features were normalized to [0,1] as described in Section 2.4.
Generation of IVIM parameter maps: To generate IVIM parameter maps as physiologic features, the DWI images were fitted with the bi-exponential decay formula of the Intravoxel Incoherent Motion (IVIM) model,
(1)
Where f is the flowing blood fraction, D is the water diffusion coefficient in the tissue, D∗ is the pseudo-diffusion coefficient of blood perfusion, and S0 is the signal without diffusion gradient. D and D∗ maps were calculated using the curve fitting function from SciPy (https://scipy.org/ version 1.9. 1). Normalized physiologic maps were created by linearly normalizing these maps over a constant range.
Registration: Aligning images between different MRI sequences is a challenging task because the motion and sensitivity of tissue interfaces can cause esophageal misalignment or distortion. The echo planar imaging (EPI) technique used in DWI sequences is highly susceptible to MRI field errors, which also affects image quality. Therefore, deformable registration is applied to all DWI sequences. As mentioned in Section 2.3.1, the MIM workflow with a deformable registration stage was developed on a multimodal algorithm [27]. The warped DWI images were also converted into voxels equidistant from T2. The workflow also included rigid registration between CE-T1 and T2 and resampling of CE-T1. All image registrations are confirmed or manually adjusted by experienced radiologists to ensure accuracy.
Clustering
We aimed to identify specific subregions or habitats within tumors and measure correlations between their VF and pathological clinical endpoints (ie, pCR and non-pCR). Our cluster analysis used the open-source Python package Scikit-learn (https://scikit-learn.org/stable/index.html, version 1.1.2). Cluster analysis was performed on the structural features, and three main clusters were obtained using the agglomerative clustering method. Agglomerative clustering is a hierarchical clustering technique that successively merges data points based on their proximity, forming a nested series of clusters. This method can be performed in an unsupervised manner, where data points are grouped purely based on their similarity. Using the same clustering algorithm, each habitat was divided into three additional clusters based on the physiologic characteristics of the different habitats. A total of 9 habitats were identified. The agglomerative clustering algorithm classifies samples in a data set into a specific number of clusters with equal variance. To avoid over-parameterizing the model for each feature type, we chose to generate 3 clusters and ultimately identified 9 habitats. Figure1 describes our MRI-based habitats analysis process.
Defining sub-regions: We defined the structural habitats as follows: an enhancing tissue habitat with high CE-T1 signal intensity irrespective of T2 signal intensity; a solid low-enhancing habitat with low T2 and CE-T1 signal intensity; and a nonviable tissue habitat with high T2 and low CE-T1 signal intensity. Low and high values were interpreted using the results of a data-driven analysis of agglomerative clustering without a specific threshold. For each dimension, the cluster with the highest average value is considered “High,” while the rest are classified as “Low.”. Once the structural habitats were created, additional sub-regions were generated based on their physiologic features from DWI-IVIM in a two-stage hierarchical manner. The D and D* parameter maps were used to define the following physiologic habitats within each structural habitat: a hypervascular cellular habitat with relatively high D* values compared to other habitats; a hypercellular habitat with relatively low D and D* values; and a common tissue habitat with relatively high D and relatively low D* values.
By combining both structural and physiologic clustering, a total of 9 habitats were created and their establishment is illustrated in Figure 2. For each habitat, the number of voxels as volume and corresponding VFs were calculated as markers to evaluate their performance in predicting treatment response.
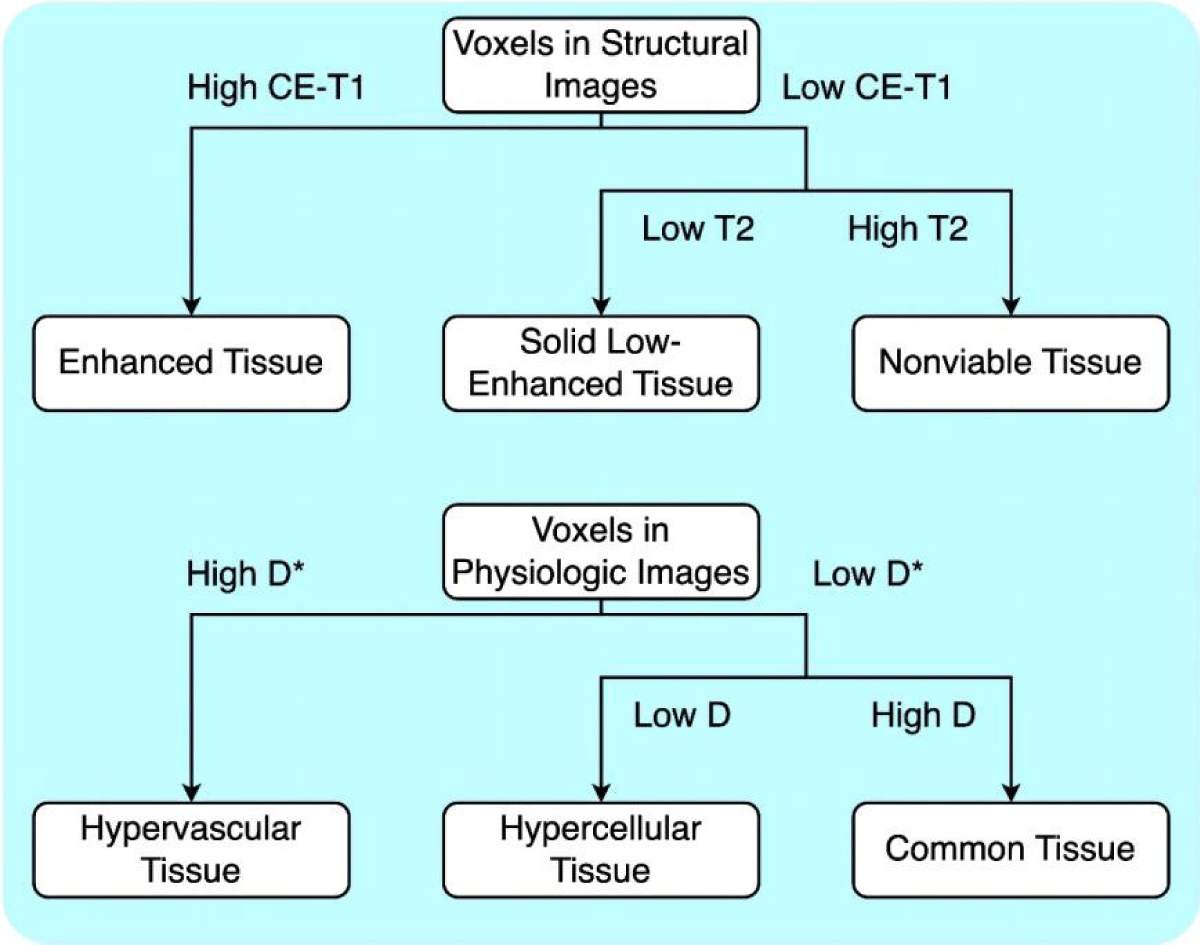
Figure 2: Habitat classification method. For habitats using structural features, the classification was applied based on mean values of T2 and CE-T1 signals. For habitats using physiologic features, classification was applied based on mean values of D and D*.
Validation of the clustering groups with pathological specimens was not feasible in this study, as the clustering features utilized were based on the patient’s baseline MRI images before treatment, while pathological examinations were conducted after radiotherapy. The timing and nature of these procedures make direct correlation challenging.
Predictive model and statistical analysis
The VFs were calculated to determine the relative size of the sub-regions as the predicting marks. Student’s t-test was conducted to identify markers that were significantly different with a p - value < 0.1. Logistic regression was then used to correlate these two markers with post-surgery histopathology results (pCR and no pCR) and develop predictive models. Receiver operating characteristic (ROC) analysis was performed to assess the predictive capability of each habitat, and the marker with the largest area under the curve (AUC) was identified as the best performer. The threshold of the logistic model for distinguishing between pCR and non-pCR patients was 0.5. To evaluate the accuracy of our model, a leave-one-out cross-validation method was employed. One sample was used as a test set while the rest was used to train the model 18 times. The mean accuracy was calculated to estimate the performance of the model.
Figure 3 shows the habitat clustering analysis results from one patient. Each patient tumor was successfully separated into 9 sub-regions (habitats). The dimensions of the tumors, measured in millimeters, exhibit a considerable degree of variability. Widths span from approximately 14.6 to 48.4 mm, heights from about 23.6 to 51.8 mm, and depths from 30.0 to over 100 mm, with one particular measurement reaching up to 105.0 mm. The volume of the tumor varies from about 3 cm3 to 66 cm3 with a mean volume of 28 cm3. Habitats are all within the tumor volume. Student’s t-test results for the 9 habitats from all patients are summarized in Figure 4. The solid low-enhanced (low T2 and CE-T1 signal intensity) with hypercellular (SL-HC; p - value = 0.06) habitat and solid low-enhanced with common (SL-C; p - value = 0.04) habitat were identified as good classifiers to differentiate patient with good or bad treatment response.
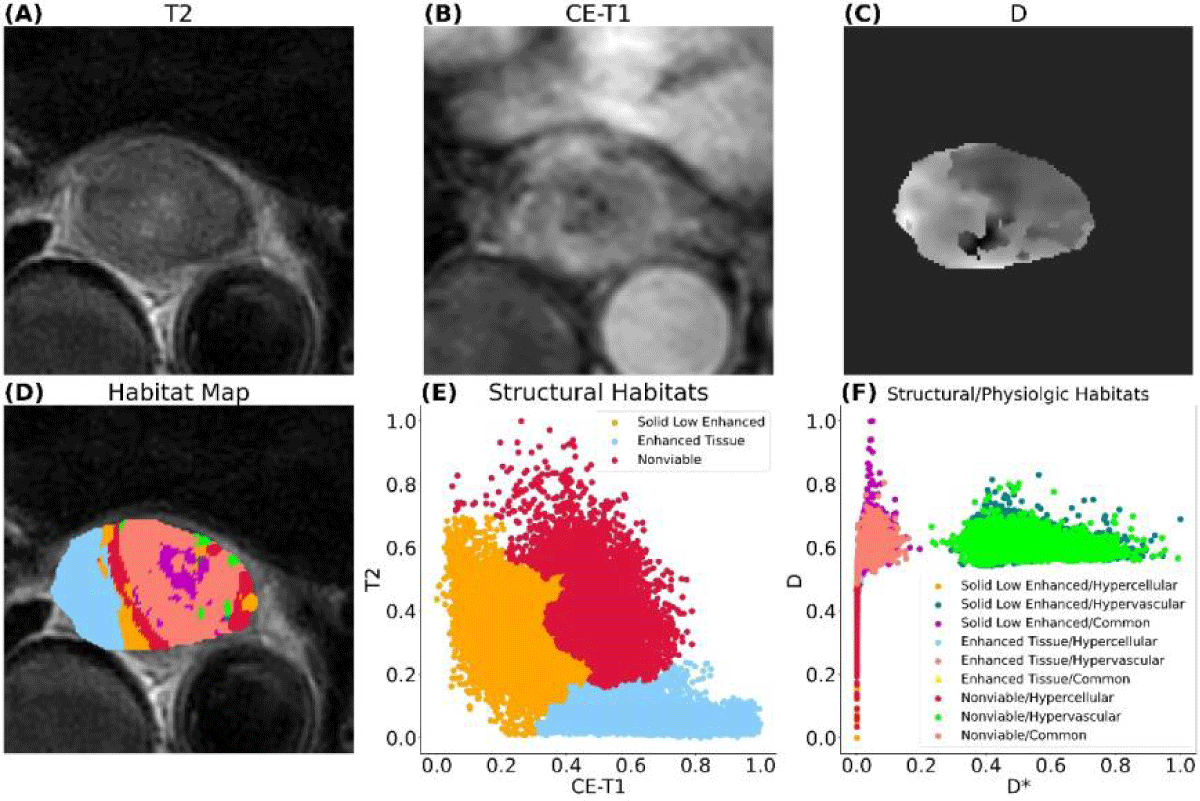
Figure 3: MRI of an esophageal cancer patient. (A)T2-weighted image, (B) contrast-enhanced T1-weighted image, (C)D parameter map of IVIM, (D) habitat map overlaid on (A), (E) first layer of clustering generating three structural habitats, (F) second layer of clustering based on structural habitats generating nine habitats with combined structural and physiologic characteristics. In this patient, the pathological test result is classified as non-pCR.
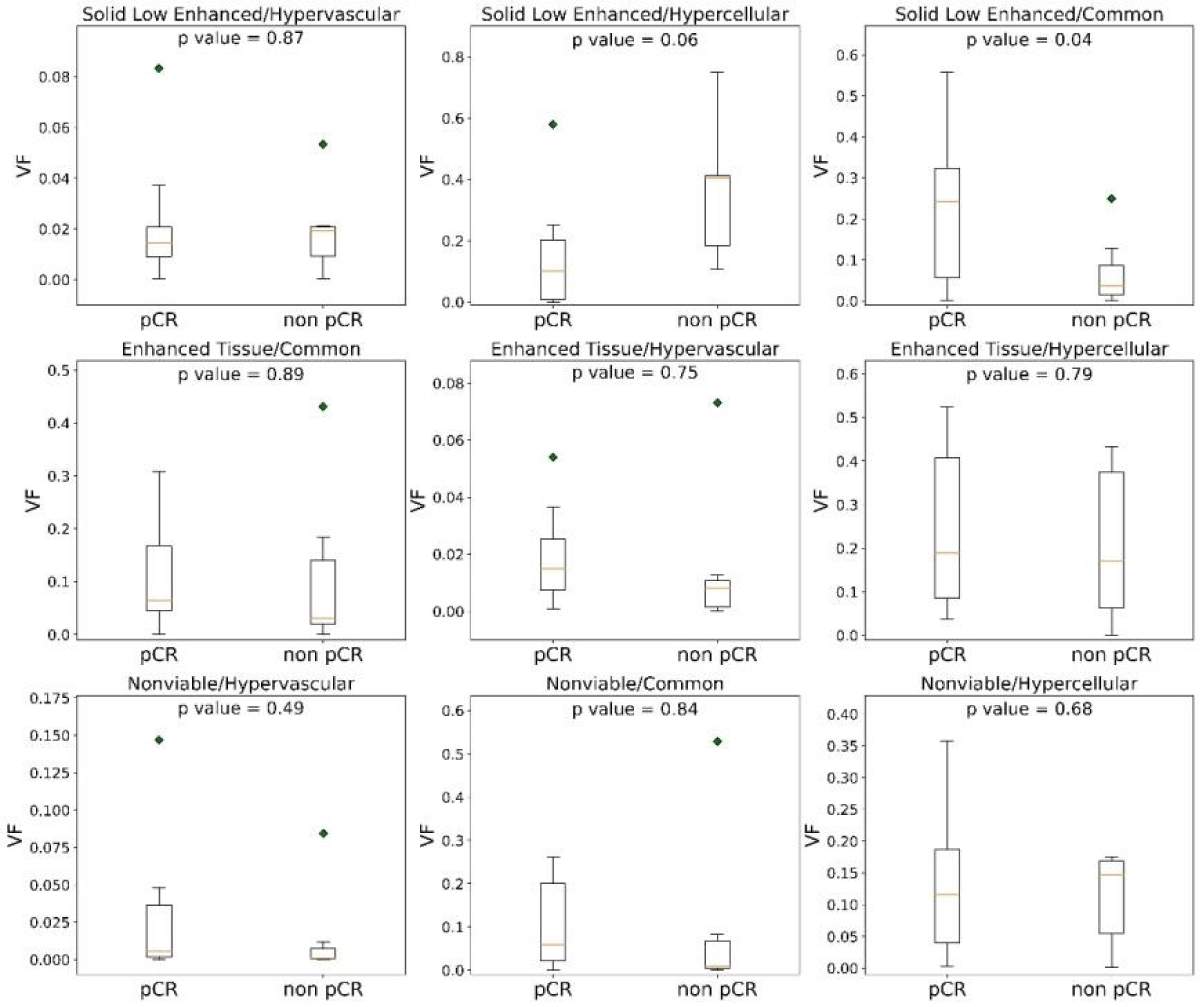
Figure 4: Volume fractions (VF) distributions of each habitat from pCR and non-pCR patients. Among the nine habitats, the volume from solid low-enhanced hypercellular and solid low-enhanced common distributions differ most significantly between the two groups.
ROC analysis was performed for the VF of each habitat to evaluate its predictive performance. As shown in Figure 5, the SL-HC habitat was identified as the best performer (AUC = 0.82), overperforming the SL-C habitat (AUC = 0.75), and the confusion matrix is also shown in Figure 6 . The habitats gained from the two-stage clustering method performed better predictive ability than those gained from one-stage of clustering using either structural or physiologic features alone. According to our observation, none of the habitats generated by a single layer of features had an AUC over 0.6. The VF of the SL-HC habitat is higher for the non-pCR group of patients. The logistic regression model was obtained by fitting the Sigmoid equation,
(2)

Figure 5: ROC curves of different habitats for discriminating all pCR- and non-pCR patients.
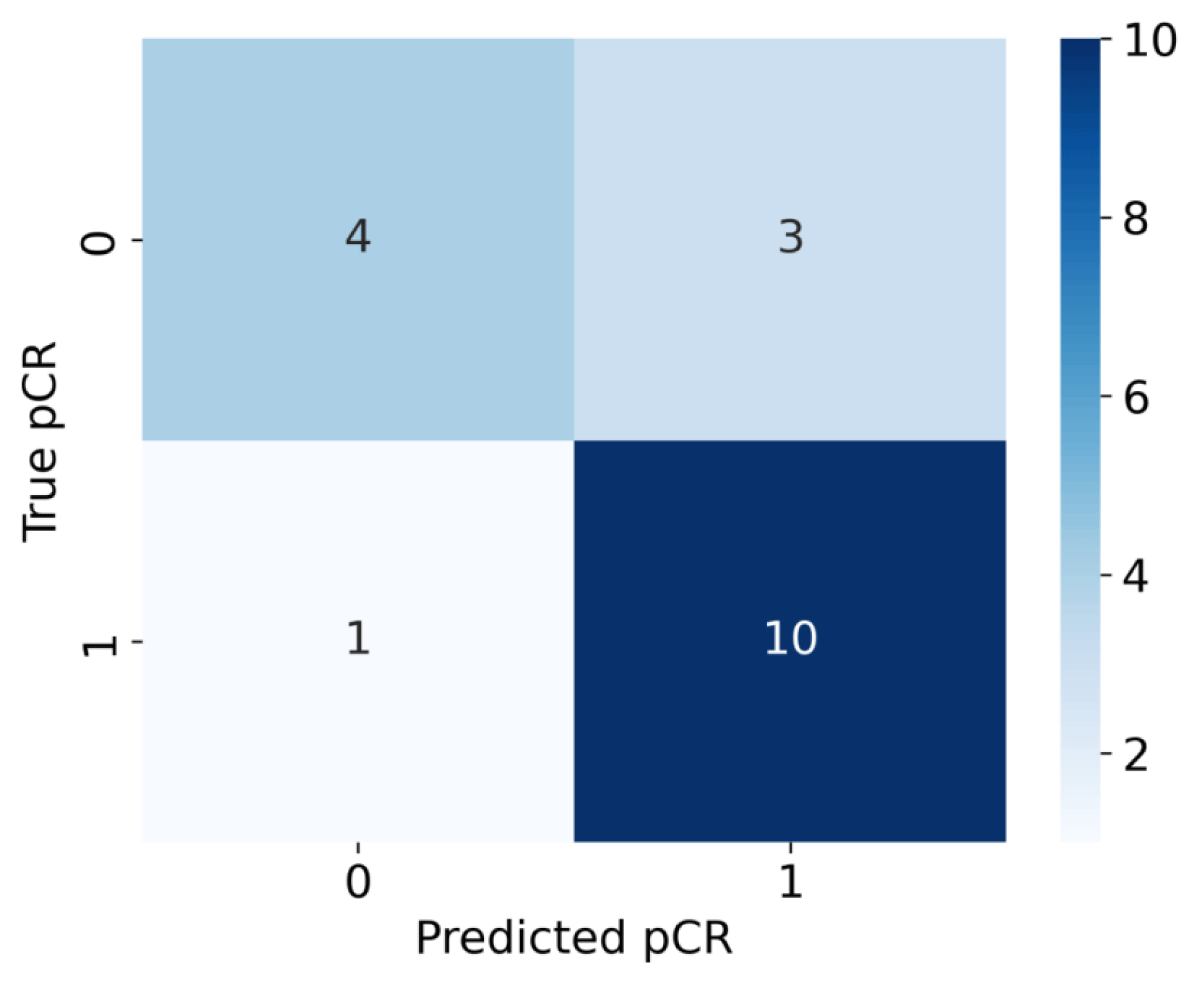
Figure 6: Matrix for logistic regression model using SL-HC volume fraction.
Where k is the scaling coefficient and b is known as the intercept. A patient with a p(VF) score higher than 0.5 would be classified as pCR and vice versa. Prediction results are shown in Table 2. To validate the predictive ability of our model, a leave-one-out cross-validation strategy was applied. The average accuracy of validation tests reached 77.79% with an average AUC reaching 0.82.
Table 2: The SL-HC clustering result for all patients and model predictions. |
||||
| Patient No. | Solid Low Enhanced/Hypercellular (Volume Fraction) | Pathological Result (1 = pCR, 0 = noo pCR) | Model Prediction (1 = pCR, 0 = non pCR) | pCR Prediction Probability |
| 1 | 0.4173 | 0 | 0 | 34.07% |
| 2 | 0.2299 | 0 | 1 | 60.93% |
| 3 | 0.1352 | 0 | 1 | 73.15% |
| 4 | 0.4086 | 0 | 0 | 35.24% |
| 5 | 0.1060 | 0 | 1 | 76.40% |
| 6 | 0.7500 | 0 | 0 | 6.78% |
| 7 | 0.4065 | 0 | 0 | 35.52% |
| 8 | 0.1140 | 1 | 1 | 75.54% |
| 9 | 0.1010 | 1 | 1 | 76.93% |
| 10 | 0.0139 | 1 | 1 | 84.78% |
| 11 | 0.0031 | 1 | 1 | 85.59% |
| 12 | 0.1963 | 1 | 1 | 65.53% |
| 13 | 0.0734 | 1 | 1 | 79.68% |
| 14 | 0.0004 | 1 | 1 | 85.78% |
| 15 | 0.2529 | 1 | 1 | 57.67% |
| 16 | 0.0004 | 1 | 1 | 85.78% |
| 17 | 0.2074 | 1 | 1 | 64.04% |
| 18 | 0.5795 | 1 | 0 | 16.58% |
This work presents a preliminary application of MRI-based habitat imaging treatment evaluation in a cohort of esophageal cancer patients. Habitat imaging based on structural and physiologic MRIs has the potential to predict esophageal cancer treatment response to nCRT. Researchers have shown that habitat imaging can identify distinct tumor sub-regions and cell populations that can be correlated with the biological state of the tissue [27,28]. Traditionally, habitat imaging to characterize tumors has been based on structural MRI. However, these sub-regions are also inherently heterogeneous. Our two-stage clustering method reveals this inherent heterogeneity, which may explain why it performs better when using a single type of feature. This advantage could also allow us to reach better performance than some other biomarkers such as ADC thresholding or radiomics features. To compare the performance between different methods, including radionics and ADC thresholding, we generated these biomarkers using the same dataset. For the ADC thresholding, the averaged ADC values in GTVs were calculated. The ROC analysis was also used to evaluate the predictive ability of ADC and the radionics features. The overall performance of both methods was no better than that of imaging habitats. The performance of our radionics features was similar to the results from Lu. S et al. [19] in predicting NACT response. Hence, the predictive ability of habitat imaging is at least not worse than these imaging quantification techniques.
In addition to predicting treatment response, the spatial information of habitats is also valuable in improving treatment from various perspectives. By defining tumor sub-regions with explainable characteristics and understanding their spatial distribution, it becomes possible to optimize/customize patient treatment, such as localized radiotherapy or a wait-and-watch approach [29,30]. Compared with MRI radiomics, due to the lack of interpretable spatial information of the micro-environment, radiomics features cannot further guide doctors to optimize radiotherapy plans. Among our patient cohort, the SL-HC sub-regions were found to be the most predictive. High cellularity may indicate rapid tissue growth and potential tumor recurrence. Concerning hypovascular sub-regions, although solid malignancies can develop blood vessels through angiogenesis [31], they tend to have relatively low vasculature until vessel invasion occurs [32]. Therefore, the presence of a relatively large fraction of a solid low-enhanced hypercellular hypovascular sub-region strongly indicates the presence of viable tumor tissue before vessel invasion. Since high cellularity consumes more oxygen when low perfusion limits the oxygen supply, it is reasonable to interpret this sub-region as a relatively hypoxic sub-region where the tumor tissue is more resistant to radiotherapy because of the absence of oxygen [33]. This hypothesis agrees with our observation that tumors with a larger fraction of “hypoxia” sub-region are less likely to reach pCR after RT. It would be reasonable to assume that increasing the dose at this sub-region can improve the pCR rate. This explainable predictor can provide medical providers with greater confidence in tailoring patient treatment accordingly. On the other hand, the Enhanced tissue\Hypervascular (E-HV) habitat also has a high AUC (0.7). This habitat, characterized by robust vascularization and active tumor tissue, may exhibit a heightened sensitivity to radiation therapy due to the increased blood supply facilitating the delivery of oxygen. While the relative size of this habitat possesses a degree of prognostic power, it is surpassed by the SL-HC habitat in terms of predictive accuracy for treatment response and recurrence risk. Compared with other techniques to measure tumor heterogeneity such as radiomics approaches, habitat imaging is gaining increasing attention due to its ability to measure tumor heterogeneity in an explainable way. The imaging habitats allow visualization of the tumor microenvironment and the monitoring of longitudinal changes, potentially providing insights into the distribution and evaluation of tumor heterogeneity.
Furthermore, the workflow in this work still has room for improvement in registration, clustering, and data acquisition. Habitat imaging depends on accurate image registration, but this process will distort the voxel values [34] as the newly aligned images contain voxel values derived from the neighboring values through interpolation. A possible solution to solve this problem is to adopt the “two-step” clustering which clusters each biomarker individually before generating habitats to minimize distortion and artificial values. Another solution to bypass this problem is to use multiple biomarkers from the same MR sequence such as DCE and DWI. DWI and DCE offer a series of biomarkers that describe many aspects of tumor physiology with the help of different models.
Another aspect for improvement is the clustering model. In this study, clustering was at the individual level mostly because the structural MR sequences lack a comparison of the intensity scale. The clusters’ boundaries for each individual are random due to the inter-personal heterogeneity of tumors. A group-level clustering would include this inter-personal heterogeneity, allowing for reproducibility across both retrospective and prospective data. In this work, unsupervised machine learning was used for clustering. Deep learning is also a candidate for achieving a semi-automatic clustering pipeline even though relevant experience is quite limited and DL’s role is still undefined.
Moreover, MRI, as the most versatile imaging modality, can be used to acquire a wide range of biomarkers containing metabolic and pathological information. Our list of advanced MR techniques includes 3D Magnetic Resonance spectroscopy imaging (MRSI) [35], Chemical exchange saturation transfer (CEST) imaging [36], and MRI-based hypoxia imaging [37]. Eventually, our goal is to design specific MRI-based habitat imaging workflows for different cancers.
Our study has limitations. First, our sample size is relatively small for this study. Including more patients will be essential in further solidifying our preliminary conclusions. We are working on collecting more data from multiple centers in the next year, to strengthen our conclusions. The plan is to reach at least 60 patients. Moreover, the patients in this study only received baseline MRI scans, periodic MRI acquisitions throughout nCRT would be necessary for longitudinal analysis to monitor the development of tumor heterogeneity. Finally, habitat imaging is a data-driven method that clusters similar voxels spatially within the GTVs. However, a strict pathological confirmation of such segmentation is difficult. It is essential to establish a validation based on spatialized standards, such as whole-mount histopathology.
In this study, we developed a habitat imaging workflow based on clinical MRIs from a cohort of esophageal cancer patients. Using this workflow, we can predict the treatment response of nCRT for LAEC patients and identify possible resistant sub-regions. The MRI-based habitat imaging based on a combination of both structural and physiologic MRI has shown great potential as a useful tool for personalized treatment for esophageal cancer. Habitat imaging with more advanced MRI acquisition and clustering techniques is needed to further improve the workflow.
Author contributions
Conceptualization, S.L. and Y.Y.; methodology, S.L.; software, S.L., Y.D., Y.H., and X.Z.; validation, S.L.; formal analysis, S.L.; investigation, S.L. and Y.Y.; resources, S.Z., X.Z., X.C., M.C., X.C., W.Q., and Y.Z. ; data curation, J.C. ; writing—original draft preparation, S.L.; writing—review and editing, Y.Y.; visualization, S.L.; supervision, F.Y.; project administration, F.Y.; funding acquisition, Y.Y. All authors have read and agreed to the published version of the manuscript.”
Ethics approval
The study was conducted in accordance with the Declaration of Helsinki, and approved by the Institutional Review Board (or Ethics Committee) of Ruijin Hospital (2023-10).
Consent to participate: Patient consent was waived due to no direct contact with patients.
Data availability statement: Research data are stored in an institutional repository and it is Ruijin Hospital’s policy not to share patients’ data.
We would like to express our gratitude to the Ruijin Hospital and United Imaging for their support to this research paper.
- Domper Arnal MJ, Ferrández Arenas Á, Lanas Arbeloa Á. Esophageal cancer: Risk factors, screening and endoscopic treatment in Western and Eastern countries. World J Gastroenterol. 2015 Jul 14;21(26):7933-43. doi: 10.3748/wjg.v21.i26.7933. PMID: 26185366; PMCID: PMC4499337.
- Nachiappan M, Kapoor VK. Esophageal Cancer: Whether and What Before or After Surgery? Indian J Surg Oncol. 2022 Dec;13(4):880-887. doi: 10.1007/s13193-022-01655-y. Epub 2022 Sep 26. PMID: 36687238; PMCID: PMC9845445.
- Hou H, Meng Z, Zhao X, Ding G, Sun M, Wang W, Wang Y. Survival of Esophageal Cancer in China: A Pooled Analysis on Hospital-Based Studies From 2000 to 2018. Front Oncol. 2019 Jun 27;9:548. doi: 10.3389/fonc.2019.00548. PMID: 31316913; PMCID: PMC6610307.
- Brown LM, Devesa SS, Chow WH. Incidence of adenocarcinoma of the esophagus among white Americans by sex, stage, and age. J Natl Cancer Inst. 2008 Aug 20;100(16):1184-7. doi: 10.1093/jnci/djn211. Epub 2008 Aug 11. PMID: 18695138; PMCID: PMC2518165.
- Shibata A, Matsuda T, Ajiki W, Sobue T. Trend in incidence of adenocarcinoma of the esophagus in Japan, 1993-2001. Jpn J Clin Oncol. 2008 Jul;38(7):464-8. doi: 10.1093/jjco/hyn064. PMID: 18664481.
- Chien CR, Lin CY, Chen CY. Re: Incidence of adenocarcinoma of the esophagus among white Americans by sex, stage, and age. J Natl Cancer Inst. 2009 Oct 21;101(20):1428; author reply 1429. doi: 10.1093/jnci/djp304. Epub 2009 Sep 1. PMID: 19724025.
- Kamangar F, Malekzadeh R, Dawsey SM, Saidi F. Esophageal cancer in Northeastern Iran: a review. Arch Iran Med. 2007 Jan;10(1):70-82. PMID: 17198458.
- Wu SX, Wang LH. Current status and perspectives of radiotherapy for esophageal cancer. Zhonghua Zhong liu za zhi [Chinese Journal of Oncology]. 2016; 38(9):650-654.
- Low DE, Kuppusamy MK, Alderson D, Cecconello I, Chang AC, Darling G, Davies A, D'Journo XB, Gisbertz SS, Griffin SM, Hardwick R, Hoelscher A, Hofstetter W, Jobe B, Kitagawa Y, Law S, Mariette C, Maynard N, Morse CR, Nafteux P, Pera M, Pramesh CS, Puig S, Reynolds JV, Schroeder W, Smithers M, Wijnhoven BPL. Benchmarking Complications Associated with Esophagectomy. Ann Surg. 2019 Feb;269(2):291-298. doi: 10.1097/SLA.0000000000002611. PMID: 29206677.
- D'Journo XB, Boulate D, Fourdrain A, Loundou A, van Berge Henegouwen MI, Gisbertz SS, O'Neill JR, Hoelscher A, Piessen G, van Lanschot J, Wijnhoven B, Jobe B, Davies A, Schneider PM, Pera M, Nilsson M, Nafteux P, Kitagawa Y, Morse CR, Hofstetter W, Molena D, So JB, Immanuel A, Parsons SL, Larsen MH, Dolan JP, Wood SG, Maynard N, Smithers M, Puig S, Law S, Wong I, Kennedy A, KangNing W, Reynolds JV, Pramesh CS, Ferguson M, Darling G, Schröder W, Bludau M, Underwood T, van Hillegersberg R, Chang A, Cecconello I, Ribeiro U Jr, de Manzoni G, Rosati R, Kuppusamy M, Thomas PA, Low DE; International Esodata Study Group. Risk Prediction Model of 90-Day Mortality After Esophagectomy for Cancer. JAMA Surg. 2021 Sep 1;156(9):836-845. doi: 10.1001/jamasurg.2021.2376. Erratum in: JAMA Surg. 2021 Sep 1;156(9):894. doi: 10.1001/jamasurg.2021.4340. PMID: 34160587; PMCID: PMC8223144.
- DeCesaris CM, Berger M, Choi JI, Carr SR, Burrows WM, Regine WF, Simone CB 2nd, Molitoris JK. Pathologic complete response (pCR) rates and outcomes after neoadjuvant chemoradiotherapy with proton or photon radiation for adenocarcinomas of the esophagus and gastroesophageal junction. J Gastrointest Oncol. 2020 Aug;11(4):663-673. doi: 10.21037/jgo-20-205. PMID: 32953150; PMCID: PMC7475327.
- Ge F, Huo Z, Cai X, Hu Q, Chen W, Lin G, Zhong R, You Z, Wang R, Lu Y, Wang R, Huang Q, Zhang H, Song A, Li C, Wen Y, Jiang Y, Liang H, He J, Liang W, Liu J. Evaluation of Clinical and Safety Outcomes of Neoadjuvant Immunotherapy Combined With Chemotherapy for Patients With Resectable Esophageal Cancer: A Systematic Review and Meta-analysis. JAMA Netw Open. 2022 Nov 1;5(11):e2239778. doi: 10.1001/jamanetworkopen.2022.39778. PMID: 36322089; PMCID: PMC9631099.
- Parikh RR, Byun J, Goyal S, Kim IY. Local Therapy Improves Overall Survival in Patients With Newly Diagnosed Metastatic Prostate Cancer. Prostate. 2017 May;77(6):559-572. doi: 10.1002/pros.23294. Epub 2017 Jan 17. PMID: 28093791.
- Dagogo-Jack I, Shaw AT. Tumour heterogeneity and resistance to cancer therapies. Nat Rev Clin Oncol. 2018 Feb;15(2):81-94. doi: 10.1038/nrclinonc.2017.166. Epub 2017 Nov 8. PMID: 29115304.
- Alfonso JCL, Berk L. Modeling the effect of intratumoral heterogeneity of radiosensitivity on tumor response over the course of fractionated radiation therapy. Radiat Oncol. 2019 May 30;14(1):88. doi: 10.1186/s13014-019-1288-y. PMID: 31146751; PMCID: PMC6543639.
- Borggreve AS, Goense L, van Rossum PSN, Heethuis SE, van Hillegersberg R, Lagendijk JJW, Lam MGEH, van Lier ALHMW, Mook S, Ruurda JP, van Vulpen M, Voncken FEM, Aleman BMP, Bartels-Rutten A, Ma J, Fang P, Musall BC, Lin SH, Meijer GJ. Preoperative Prediction of Pathologic Response to Neoadjuvant Chemoradiotherapy in Patients With Esophageal Cancer Using 18F-FDG PET/CT and DW-MRI: A Prospective Multicenter Study. Int J Radiat Oncol Biol Phys. 2020 Apr 1;106(5):998-1009. doi: 10.1016/j.ijrobp.2019.12.038. Epub 2020 Jan 25. PMID: 31987972; PMCID: PMC7103753.
- Liu Z, Zhang XY, Shi YJ, Wang L, Zhu HT, Tang Z, Wang S, Li XT, Tian J, Sun YS. Radiomics Analysis for Evaluation of Pathological Complete Response to Neoadjuvant Chemoradiotherapy in Locally Advanced Rectal Cancer. Clin Cancer Res. 2017 Dec 1;23(23):7253-7262. doi: 10.1158/1078-0432.CCR-17-1038. Epub 2017 Sep 22. PMID: 28939744.
- Shin J, Seo N, Baek SE, Son NH, Lim JS, Kim NK, Koom WS, Kim S. MRI Radiomics Model Predicts Pathologic Complete Response of Rectal Cancer Following Chemoradiotherapy. Radiology. 2022 May;303(2):351-358. doi: 10.1148/radiol.211986. Epub 2022 Feb 8. PMID: 35133200.
- Lu S, Wang C, Liu Y, Chu F, Jia Z, Zhang H, Wang Z, Lu Y, Wang S, Yang G, Qu J. The MRI radiomics signature can predict the pathologic response to neoadjuvant chemotherapy in locally advanced esophageal squamous cell carcinoma. Eur Radiol. 2024 Jan;34(1):485-494. doi: 10.1007/s00330-023-10040-4. Epub 2023 Aug 4. PMID: 37540319.
- Jardim-Perassi VB, Martinez G, Gillies R. Habitat imaging of tumor evolution by magnetic resonance imaging (MRI). In: Radiomics and Radiogenomics: Technical Basis and Clinical Applications. 2019;115.
- Stringfield O, Arrington JA, Johnston SK, Rognin NG, Peeri NC, Balagurunathan Y, Jackson PR, Clark-Swanson KR, Swanson KR, Egan KM, Gatenby RA, Raghunand N. Multiparameter MRI Predictors of Long-Term Survival in Glioblastoma Multiforme. Tomography. 2019 Mar;5(1):135-144. doi: 10.18383/j.tom.2018.00052. PMID: 30854451; PMCID: PMC6403044.
- Lee DH, Park JE, Kim N, Park SY, Kim YH, Cho YH, Kim JH, Kim HS. Tumor Habitat Analysis Using Longitudinal Physiological MRI to Predict Tumor Recurrence After Stereotactic Radiosurgery for Brain Metastasis. Korean J Radiol. 2023 Mar;24(3):235-246. doi: 10.3348/kjr.2022.0492. Epub 2023 Feb 6. PMID: 36788768; PMCID: PMC9971843.
- Park JE, Kim HS, Kim N, Park SY, Kim YH, Kim JH. Spatiotemporal Heterogeneity in Multiparametric Physiologic MRI Is Associated with Patient Outcomes in IDH-Wildtype Glioblastoma. Clin Cancer Res. 2021 Jan 1;27(1):237-245. doi: 10.1158/1078-0432.CCR-20-2156. Epub 2020 Oct 7. PMID: 33028594.
- Lerttanatum N, Tharavej C, Chongpison Y, Sanpavat A. Comparison of tumor regression grading system in locally advanced esophageal squamous cell carcinoma after preoperative radio-chemotherapy to determine the most accurate system predicting prognosis. J Gastrointest Oncol. 2019 Apr;10(2):276-282. doi: 10.21037/jgo.2018.12.01. PMID: 31032095; PMCID: PMC6465493.
- Ajani JA, D'Amico TA, Bentrem DJ, Chao J, Corvera C, Das P, Denlinger CS, Enzinger PC, Fanta P, Farjah F, Gerdes H, Gibson M, Glasgow RE, Hayman JA, Hochwald S, Hofstetter WL, Ilson DH, Jaroszewski D, Johung KL, Keswani RN, Kleinberg LR, Leong S, Ly QP, Matkowskyj KA, McNamara M, Mulcahy MF, Paluri RK, Park H, Perry KA, Pimiento J, Poultsides GA, Roses R, Strong VE, Wiesner G, Willett CG, Wright CD, McMillian NR, Pluchino LA. Esophageal and Esophagogastric Junction Cancers, Version 2.2019, NCCN Clinical Practice Guidelines in Oncology. J Natl Compr Canc Netw. 2019 Jul 1;17(7):855-883. doi: 10.6004/jnccn.2019.0033. PMID: 31319389.
- Martin-Romano P, Sola JJ, Diaz-Gonzalez JA, Chopitea A, Iragorri Y, Martínez-Regueira F, Ponz-Sarvise M, Arbea L, Subtil JC, Cano D, Ceniceros L, Legaspi J, Hernandez JL, Rodríguez J. Role of histological regression grade after two neoadjuvant approaches with or without radiotherapy in locally advanced gastric cancer. Br J Cancer. 2016 Sep 6;115(6):655-63. doi: 10.1038/bjc.2016.252. Epub 2016 Aug 18. PMID: 27537382; PMCID: PMC5023782.
- Piper J, Nelson A, Harper J. Deformable image registration in mim maestro evaluation and description. Cleveland, OH: MiM Software Inc, 2013.
- O'Connor JP, Rose CJ, Waterton JC, Carano RA, Parker GJ, Jackson A. Imaging intratumor heterogeneity: role in therapy response, resistance, and clinical outcome. Clin Cancer Res. 2015 Jan 15;21(2):249-57. doi: 10.1158/1078-0432.CCR-14-0990. Epub 2014 Nov 24. PMID: 25421725; PMCID: PMC4688961.
- Tomaszewski MR, Gillies RJ. The Biological Meaning of Radiomic Features. Radiology. 2021 Mar;298(3):505-516. doi: 10.1148/radiol.2021202553. Epub 2021 Jan 5. Erratum in: Radiology. 2021 May;299(2):E256. doi: 10.1148/radiol.2021219005. PMID: 33399513; PMCID: PMC7924519.
- Enderling H, Alfonso JCL, Moros E, Caudell JJ, Harrison LB. Integrating Mathematical Modeling into the Roadmap for Personalized Adaptive Radiation Therapy. Trends Cancer. 2019 Aug;5(8):467-474. doi: 10.1016/j.trecan.2019.06.006. Epub 2019 Jul 10. PMID: 31421904.
- Barzi A, Lenz HJ. Angiogenesis-related agents in esophageal cancer. Expert Opin Biol Ther. 2012 Oct;12(10):1335-45. doi: 10.1517/14712598.2012.707180. Epub 2012 Aug 4. PMID: 22860627.
- Liu Q, Zhang H, Jiang X, Qian C, Liu Z, Luo D. Factors involved in cancer metastasis: a better understanding to "seed and soil" hypothesis. Mol Cancer. 2017 Dec 2;16(1):176. doi: 10.1186/s12943-017-0742-4. PMID: 29197379; PMCID: PMC5712107.
- Bouleftour W, Rowinski E, Louati S, Sotton S, Wozny AS, Moreno-Acosta P, Mery B, Rodriguez-Lafrasse C, Magne N. A Review of the Role of Hypoxia in Radioresistance in Cancer Therapy. Med Sci Monit. 2021 Nov 3;27:e934116. doi: 10.12659/MSM.934116. PMID: 34728593; PMCID: PMC8573967.
- Cebulla J, Kim E, Rhie K, Zhang J, Pathak AP. Multiscale and multi-modality visualization of angiogenesis in a human breast cancer model. Angiogenesis. 2014 Jul;17(3):695-709. doi: 10.1007/s10456-014-9429-2. Epub 2014 Apr 10. PMID: 24719185; PMCID: PMC5538401.
- Hingerl L, Strasser B, Moser P, Hangel G, Motyka S, Heckova E, Gruber S, Trattnig S, Bogner W. Clinical High-Resolution 3D-MR Spectroscopic Imaging of the Human Brain at 7 T. Invest Radiol. 2020 Apr;55(4):239-248. doi: 10.1097/RLI.0000000000000626. PMID: 31855587.
- Zhang Y, Heo HY, Jiang S, Zhou J, Bottomley PA. Fast 3D chemical exchange saturation transfer imaging with variably-accelerated sensitivity encoding (vSENSE). Magn Reson Med. 2019 Dec;82(6):2046-2061. doi: 10.1002/mrm.27881. Epub 2019 Jul 1. PMID: 31264278.
- Brender JR, Saida Y, Devasahayam N, Krishna MC, Kishimoto S. Hypoxia Imaging As a Guide for Hypoxia-Modulated and Hypoxia-Activated Therapy. Antioxid Redox Signal. 2022 Jan;36(1-3):144-159. doi: 10.1089/ars.2021.0176. PMID: 34428981; PMCID: PMC8856011.